
You have been focusing on learning essential digital marketing skills. These include website building, email automation, social media promotion, SEO, content creation, and leveraging AI tools like ChatGPT. To put these skills into practice and enhance your job prospects, you might have reached out to potential employers. Therefore, the goals must have been to increase the visibility of the content, drive website traffic from target company employees, and appeal to potential employers through their demonstrated skills. To evaluate the performance of those efforts, you will be using Google Analytics 4 (GA4) to analyze data collected on various metrics, providing insights into the effectiveness of your digital marketing strategies.
Key metrics in your context
GA4 has various metrics but you will select the most relevant ones in your context. They include:
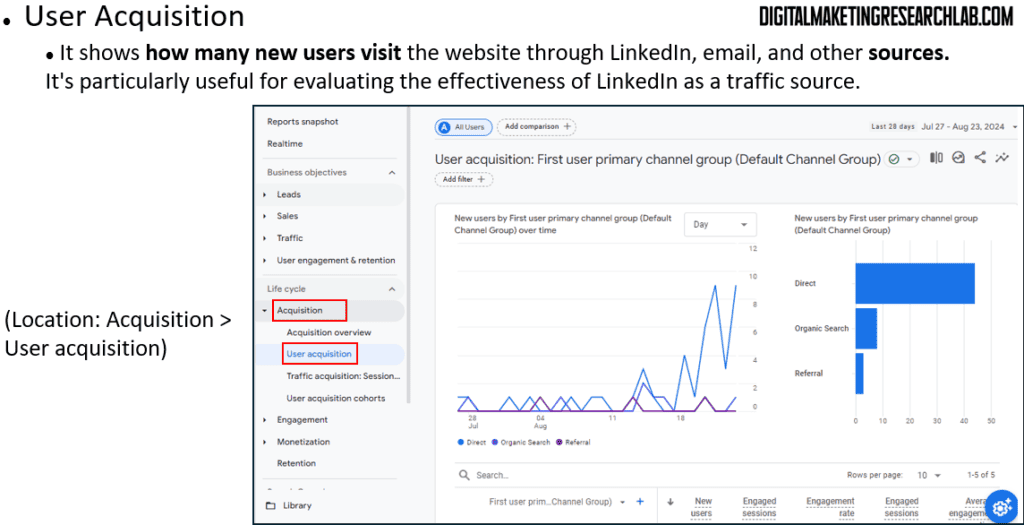
User acquisition: It shows how many new users visit the website through LinkedIn, email, and other sources. It’s particularly useful for evaluating the effectiveness of LinkedIn as a traffic source.
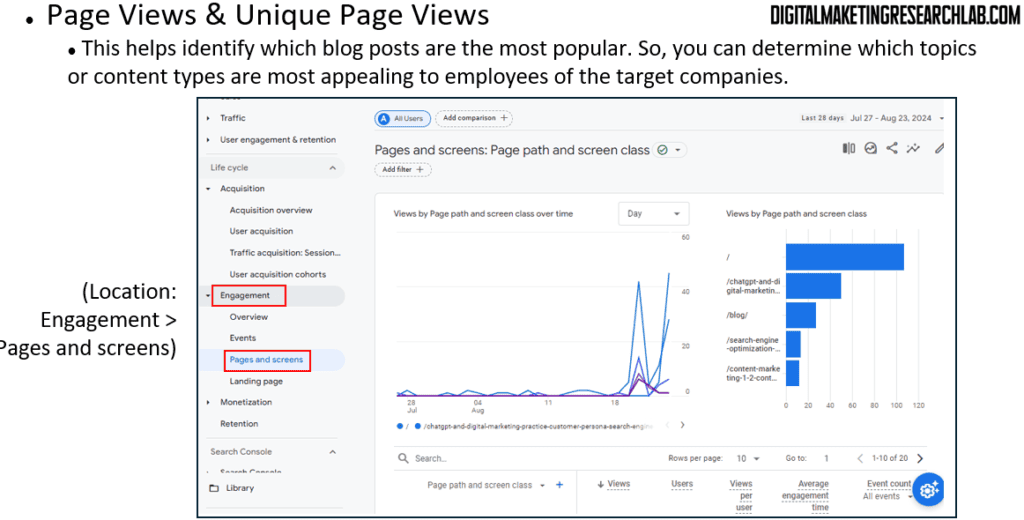
Page Views & Unique Page Views: This helps identify which blog posts are the most popular. So, you can determine which topics or content types are most appealing to employees of the target companies.
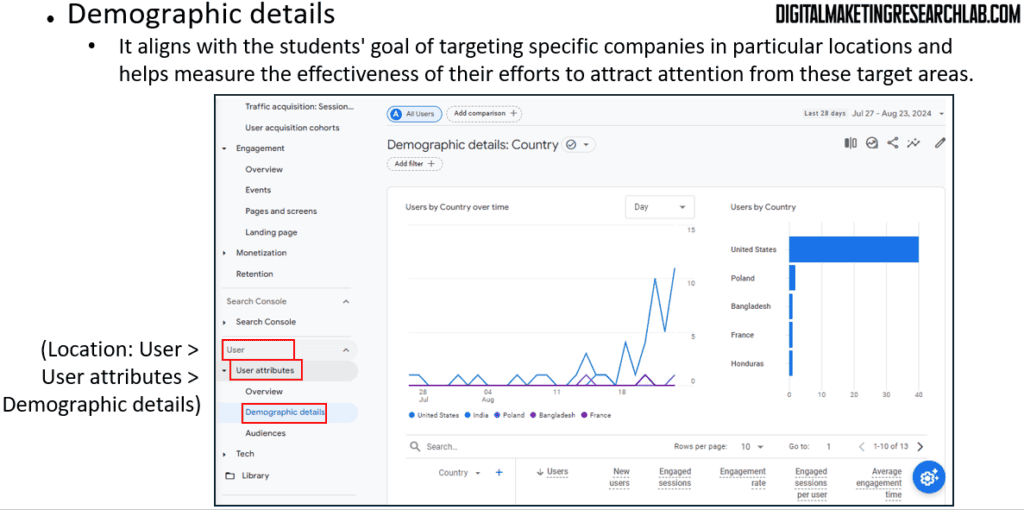
Demographic details: It aligns with the your goal of targeting specific companies in particular locations and helps measure the effectiveness of their efforts to attract attention from these target areas.
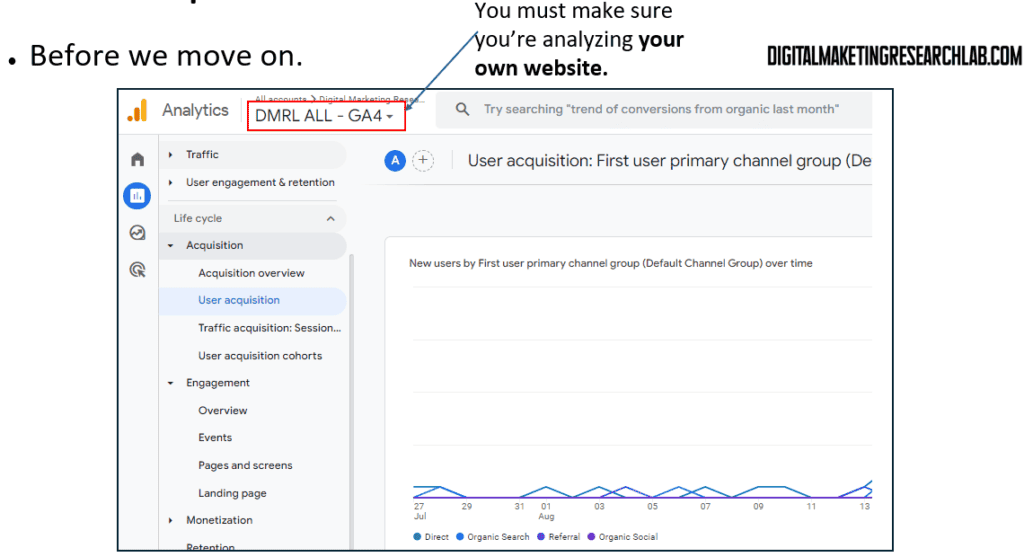
Before you move on, you must make sure you’re analyzing your own website.
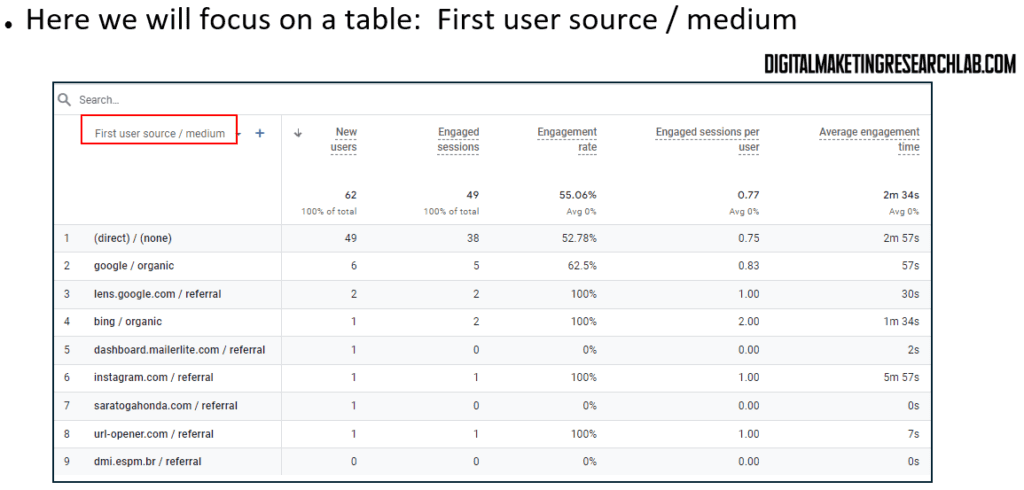
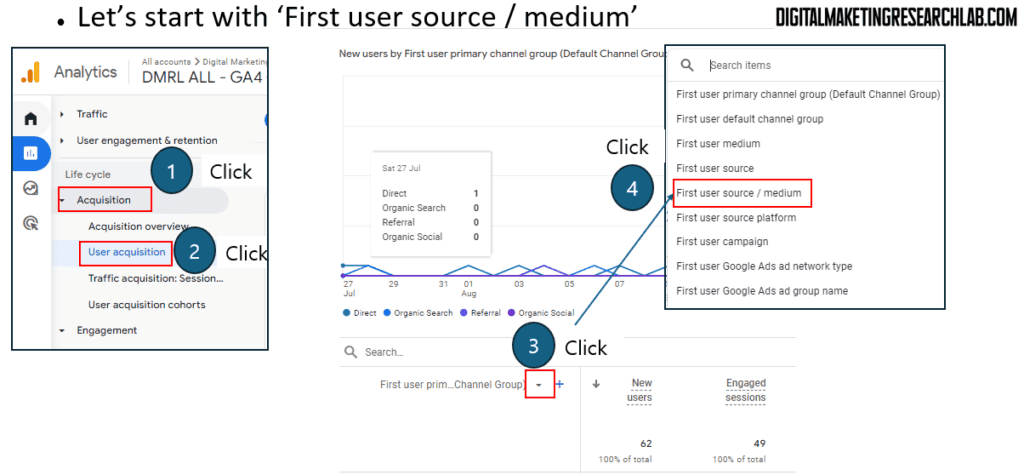
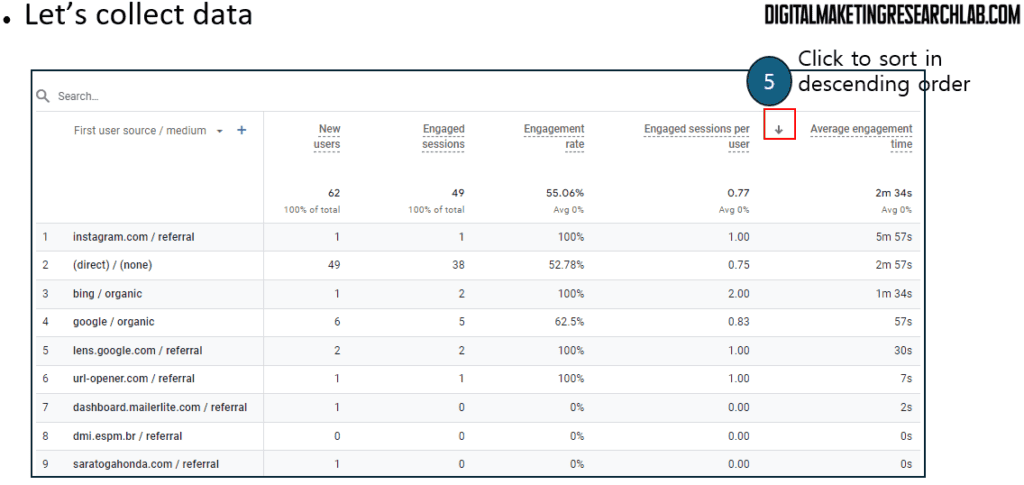
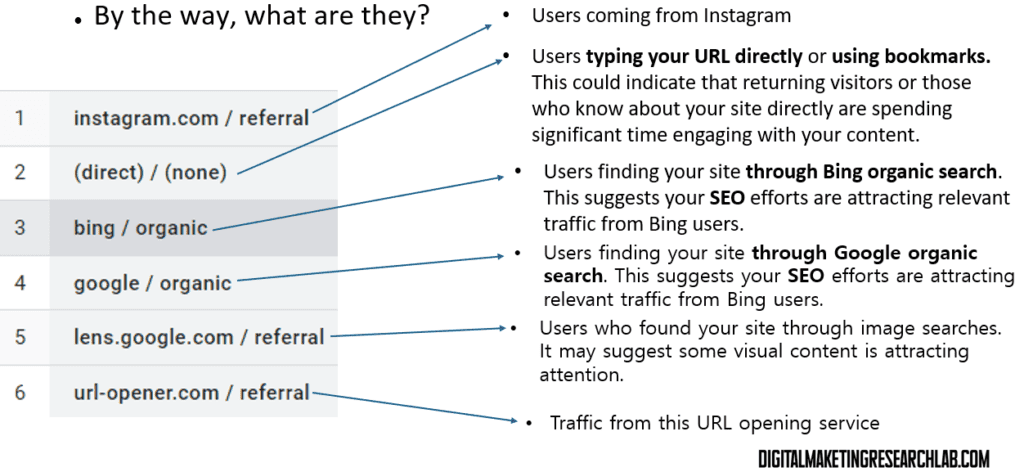
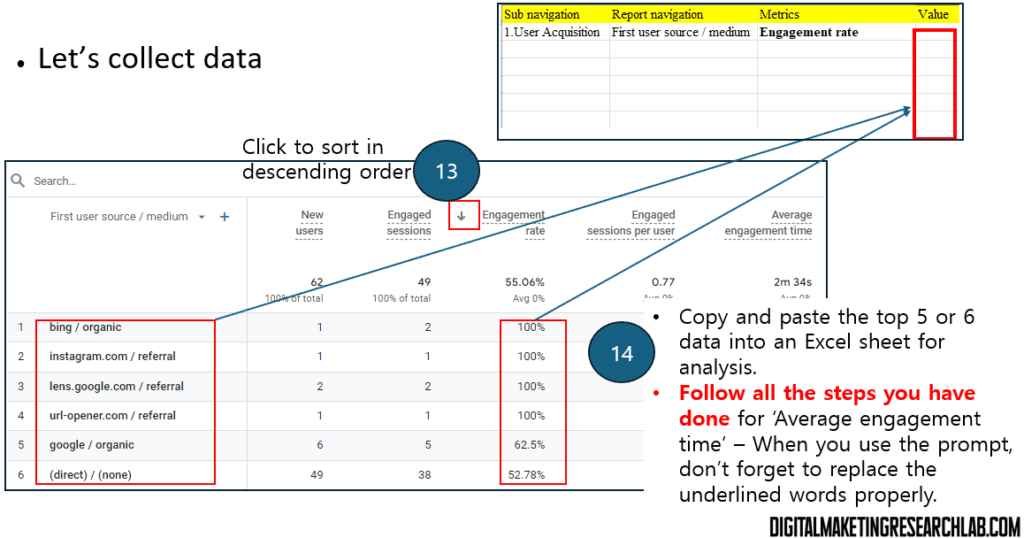
Here you will focus on a table: First user source / medium
Simply follow the steps below.
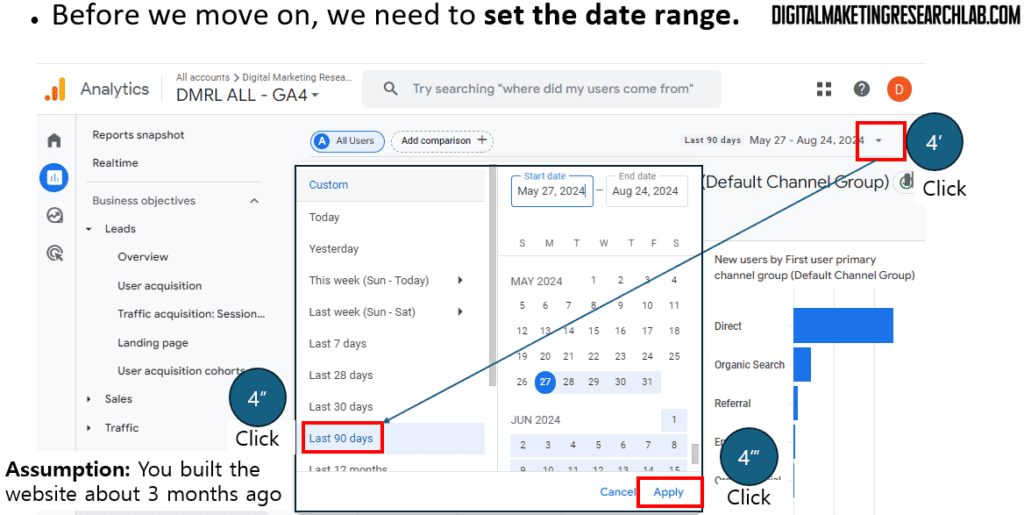
Before you move on, you need to set the date range. If you have built your website about 3 months ago, you need to choose ‘Last 90 days’.
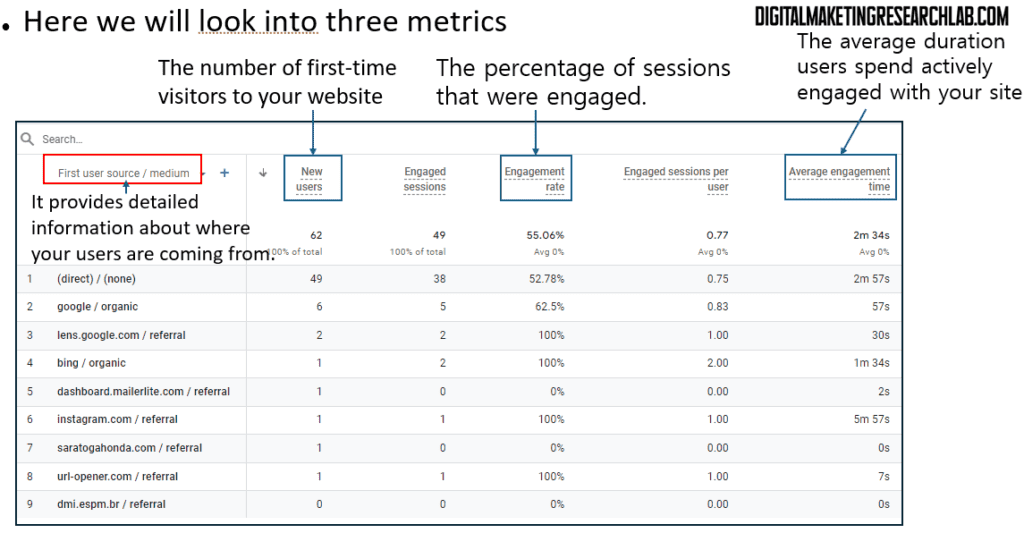
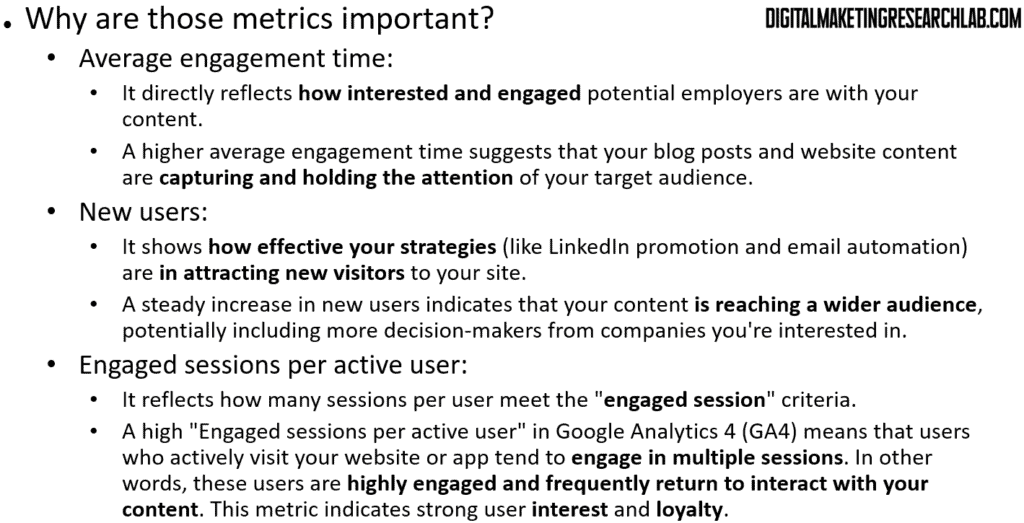
Here, you will look into three metrics: New users, Engagement rate, Engaged sessions per active user, and Average engagement time.
- New users: The number of first-time visitors to your website
Engagement rate: The percentage of sessions that were engaged.(Engagement metric is not available anymore. Instead, ‘Engaged session per active user’ needs to be explored)- Engaged sessions per active user: The number of sessions per user that meets the “engaged session” criteria
- Average engagement time: The average duration users spend actively engaged with your site
They are selected for the reasons below
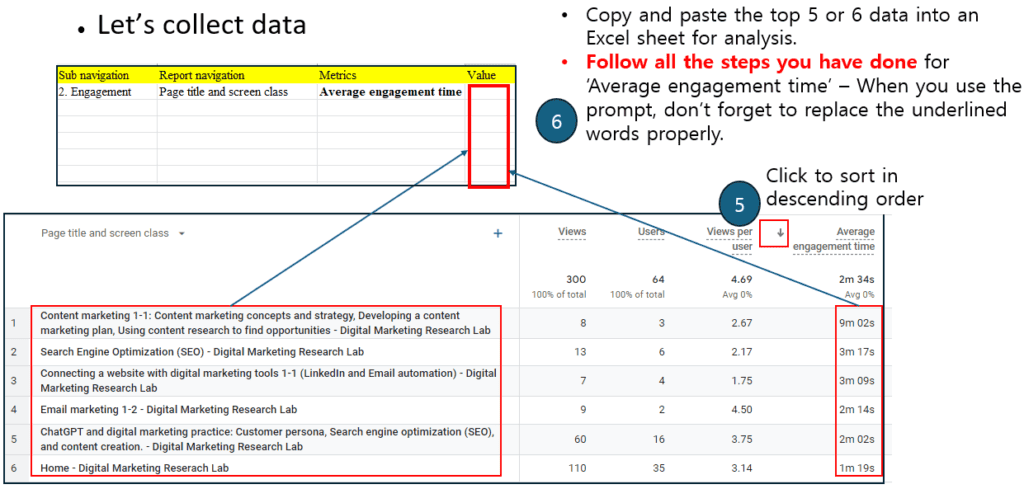
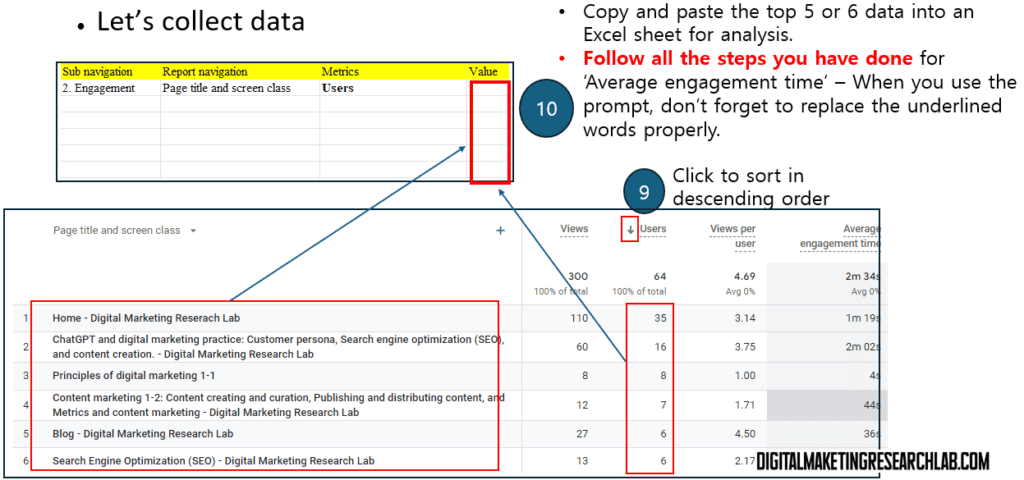
Let’s collect data about ‘Average engagement time’ for analysis
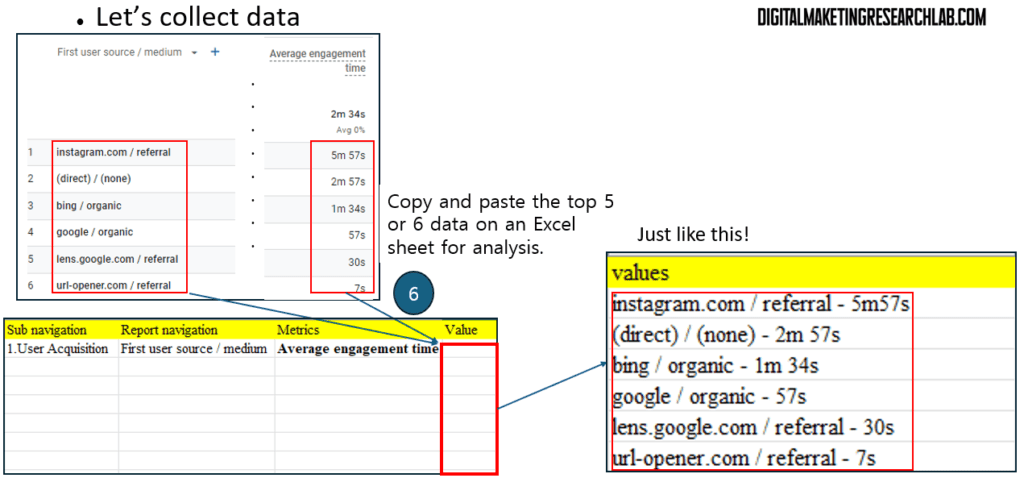
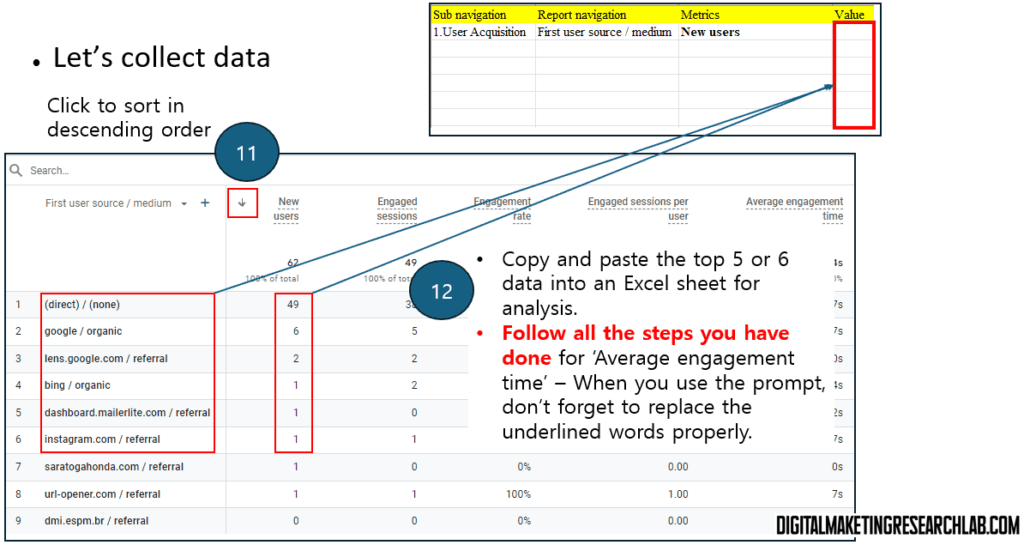
Here you can find the result. You need to create an Excel sheet with the following items. As you can see below, simply copy and paste the top 5 or 6 data on the Excel sheet for analysis.
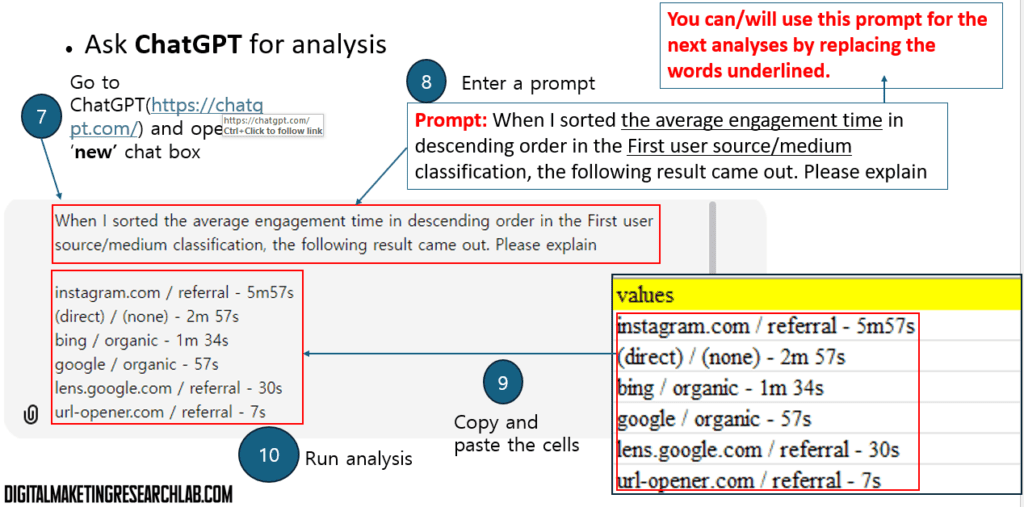
For analysis, you will use ChatGPT.
1. Go to ChatGPT(https://chatgpt.com/) and open a ‘new’ chat box
2. Enter the following prompt. You can/will use this prompt for the next analyses by replacing the underlined words.
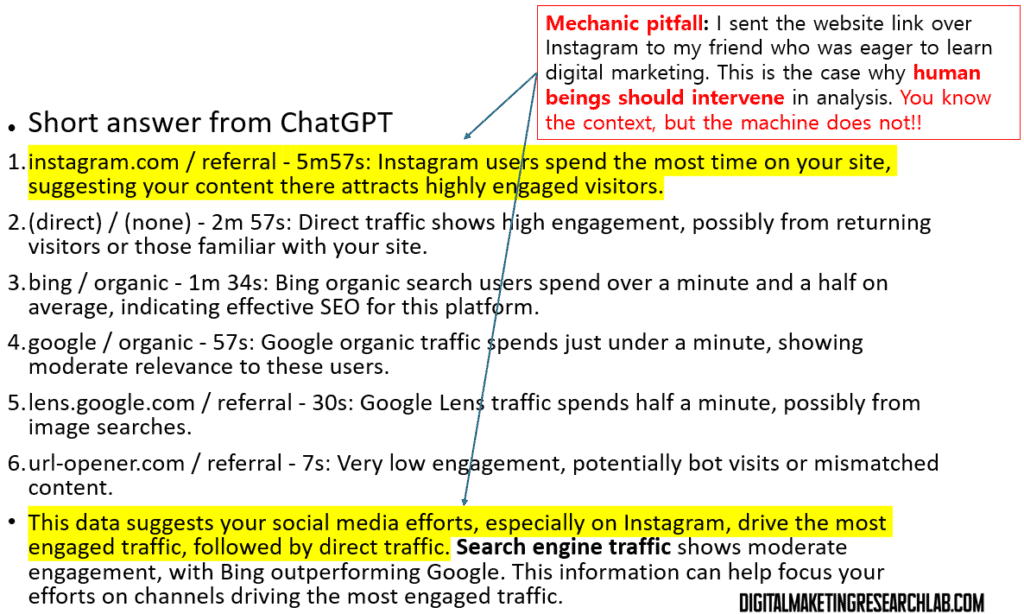
Prompt: When I sorted the average engagement time in descending order in the First user source/medium classification, the following result came out. Please explain
3. Copy the cells and paste them just below the prompt on the hat box.
If you are not familiar with the ‘source / medium’, you can refer to the picture below.
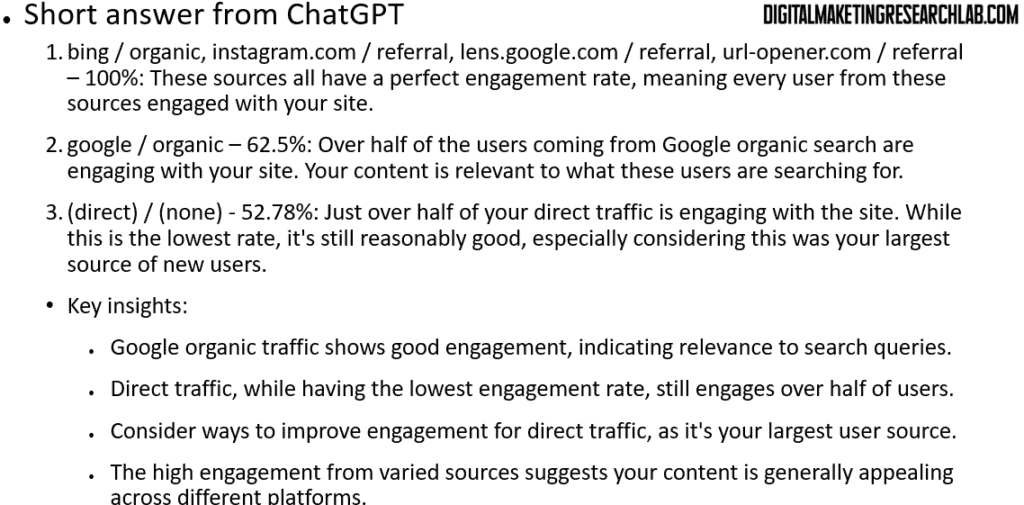
You can see the analysis from ChatGPT. However, ChatGPT does not know all your context. So, you may encounter mechanic pitfalls. In this example, I sent the website link over Instagram to my friend who was eager to learn digital marketing. Therefore, the analysis regarding Instagram should be rejected. This is the case why human beings should intervene in analysis. You know the context, but the machine does not!
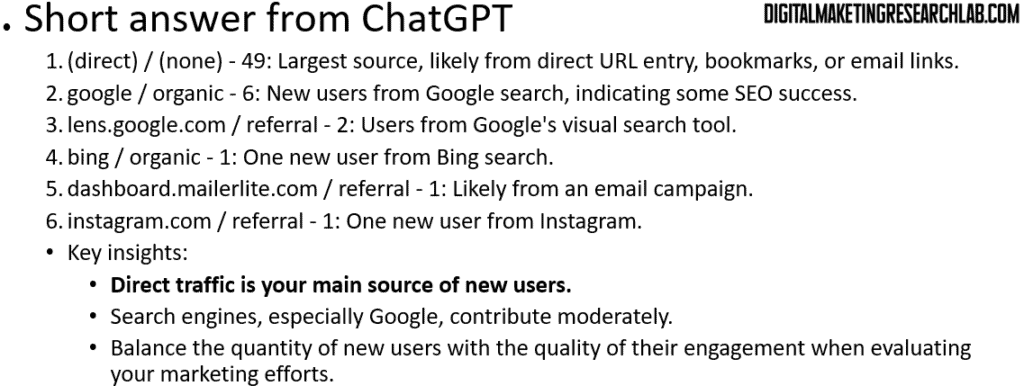
Let’s move on. It’s time to collect data on ‘New users’. As you have taken this step once, you must be getting used to it.
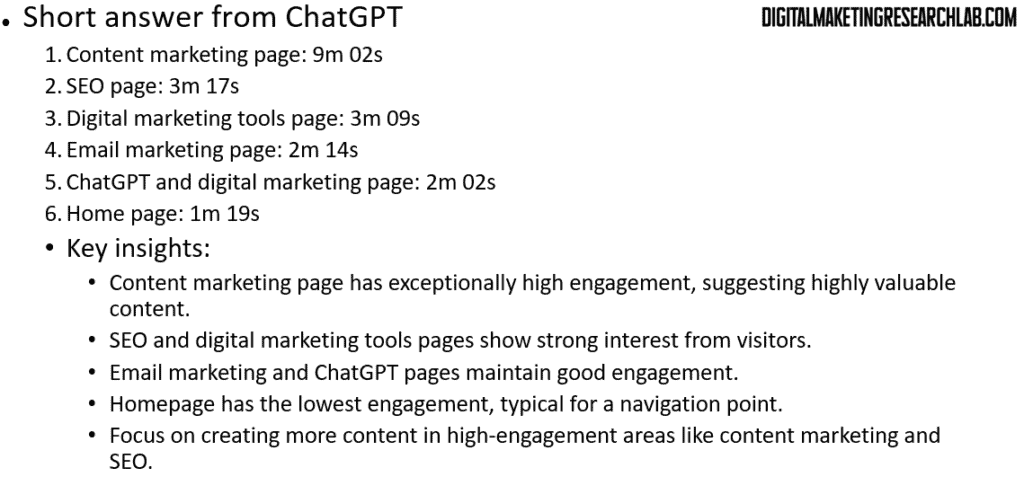
Here is the analysis from ChatGPT.
Let’s repeat the step for ‘Engagement rate’ ‘Engaged sessions per active user’.
You can have the analysis result from ChatGPT
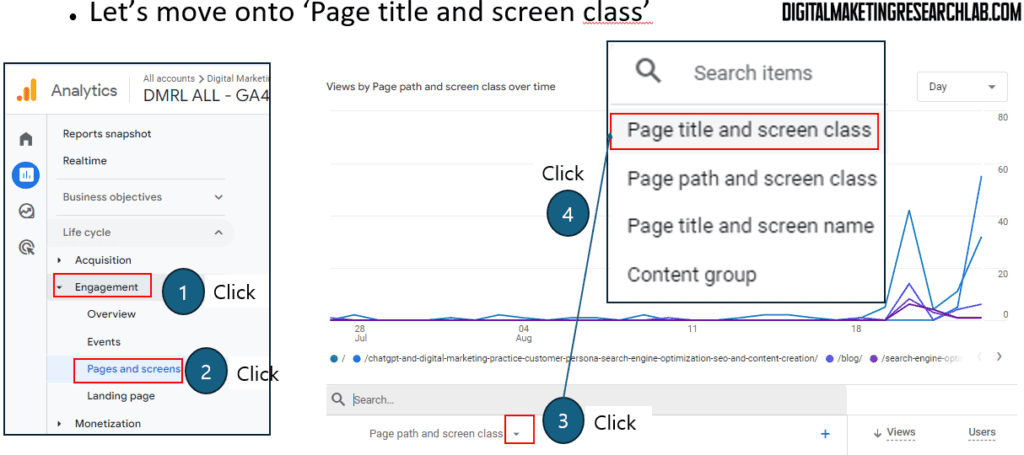
Let’s move onto ‘Page title and screen class’
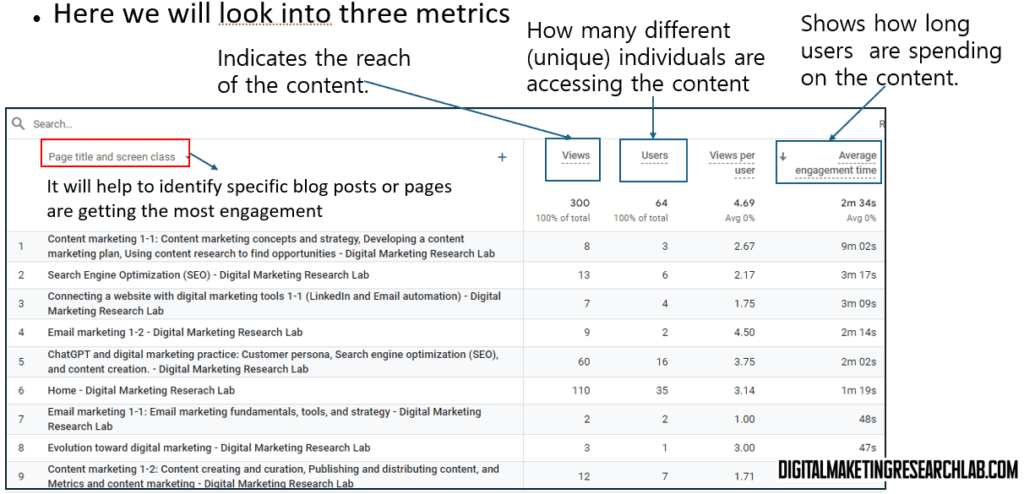
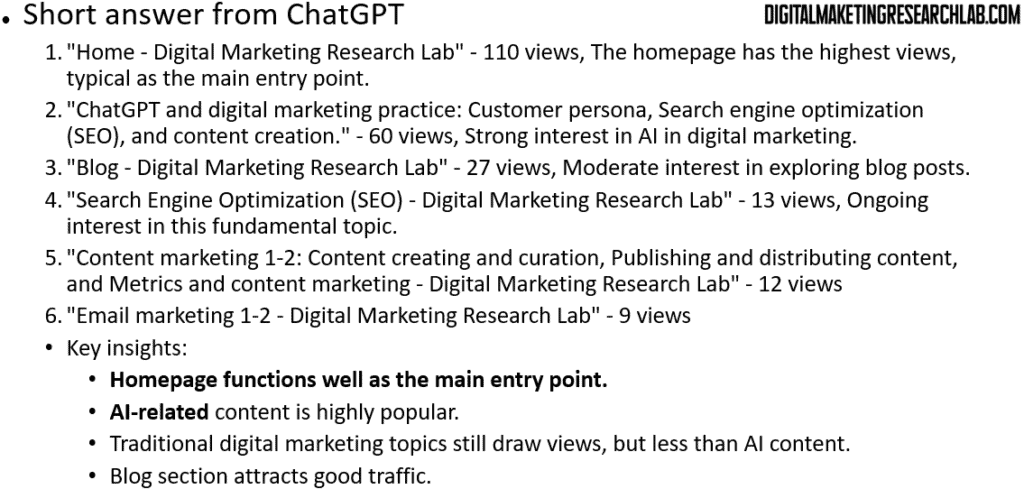
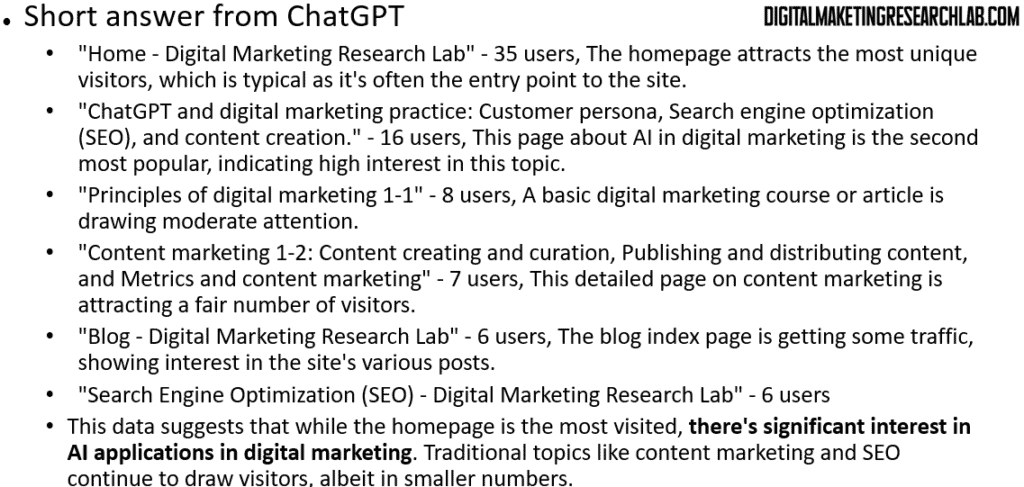
Here, you will focus on Views, Users, and Average engagement time.
- Views: It Indicates the reach of the content.
- Users:: It tells you how many different (unique) individuals are accessing the content
- Average engagement time: It shows how long users are spending on the content.
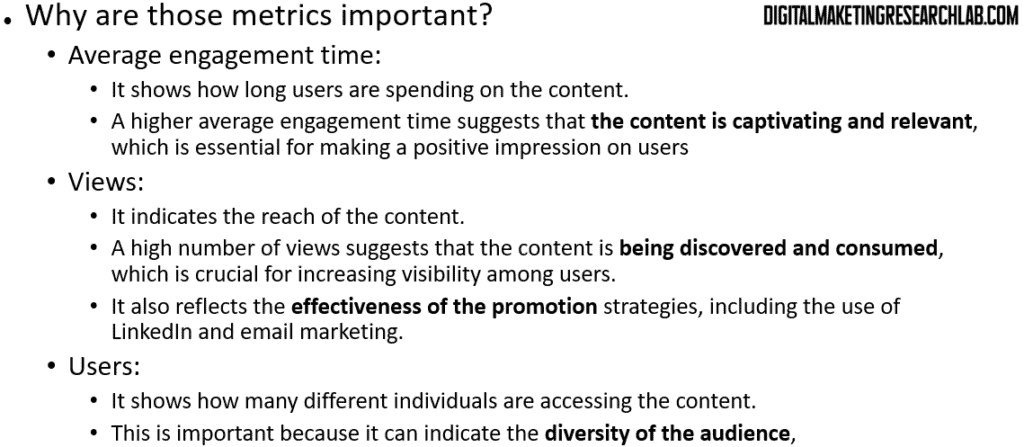
They are selected for the reasons below
- Average engagement time: It shows how long users are spending on the content. A higher average engagement time suggests that the content is captivating and relevant, which is essential for making a positive impression on users
- Views: It indicates the reach of the content. A high number of views suggests that the content is being discovered and consumed, which is crucial for increasing visibility among users. It also reflects the effectiveness of the promotion strategies, including the use of LinkedIn and email marketing.
- Users: It shows how many different individuals are accessing the content. This is important because it can indicate the diversity of the audience
Let’s collect data on ‘Average engagement time’ repeating the steps you have taken before.
You can have the analysis result from ChatGPT
Let’s collect data on ‘Views’ by repeating the steps you have taken before.
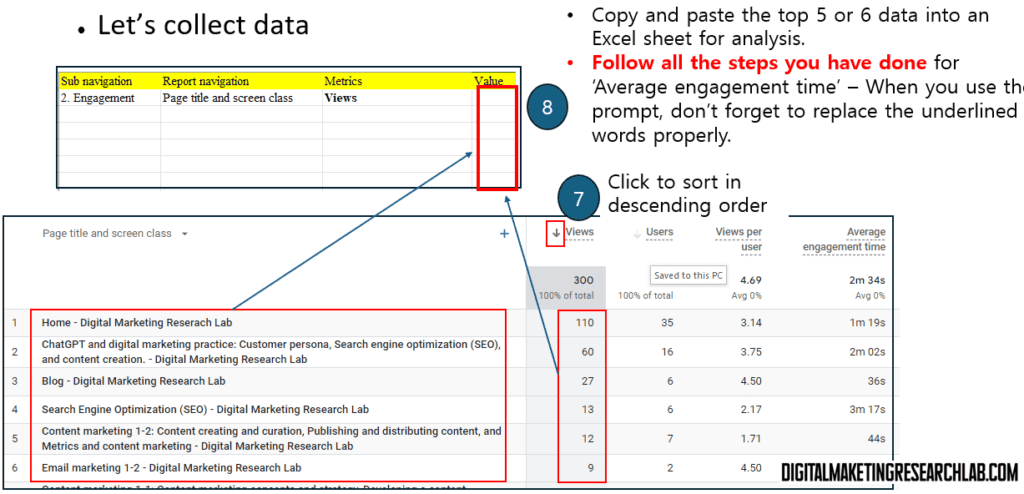
You can have the analysis result from ChatGPT
Let’s collect data on ‘Users’ by repeating the steps you have taken before.
You can have the analysis result from ChatGPT
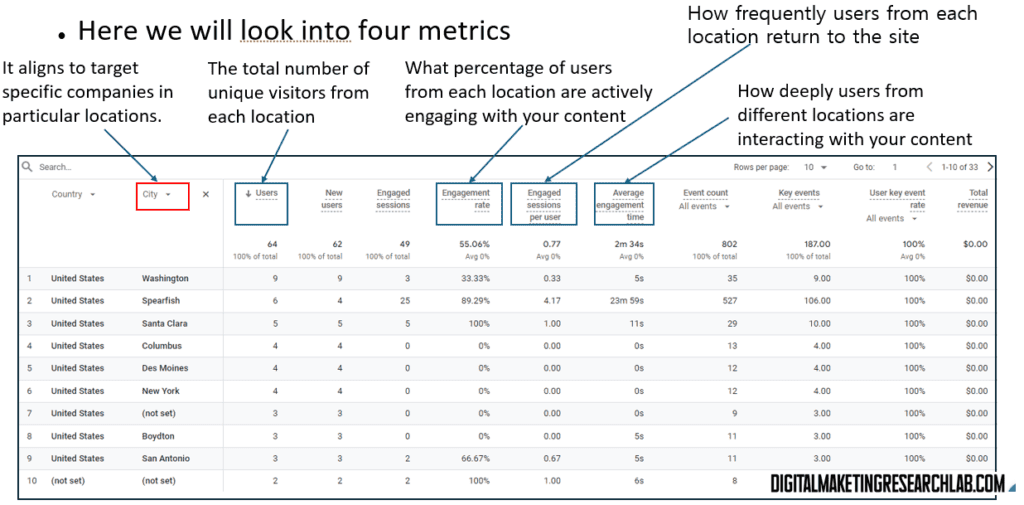
Let’s move onto ‘Country and city’
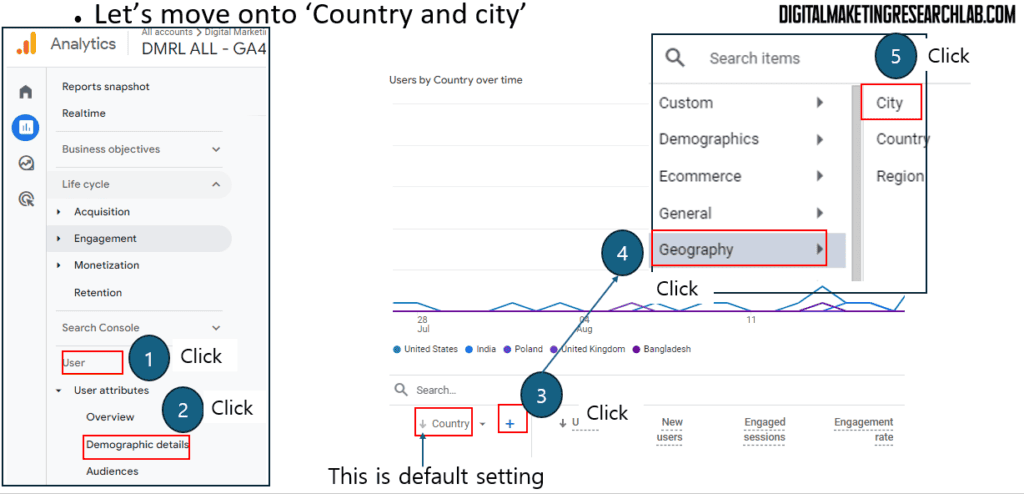
Here, we will check on two combined primary dimensions, country and city. This combination aligns to target specific companies in particular locations.
Also, we will look at four metrics: Active users, Engagement rate, Engaged sessions per active user, and Average engagement time per active user.
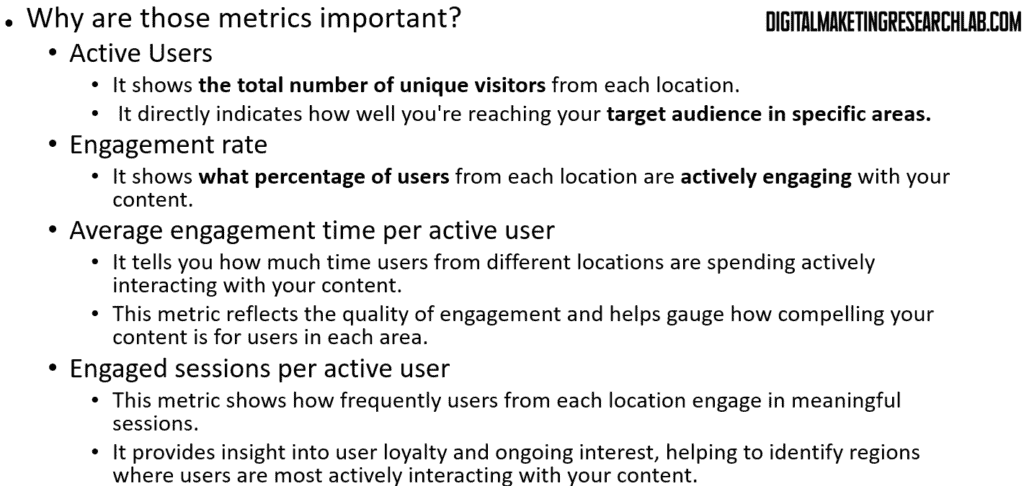
- Active users (Previously Users): The total number of unique visitors from each location
- Engagement rate: What percentage of users from each location are actively engaging with your content
- Engaged sessions per active user (Previously Engaged sessions per user): How frequently users from each location return to the site
- Average engagement time per active users (Previously Average engagement time): How much time users from different locations are spending actively interacting with your content
Those four metrics are selected for the reasons below
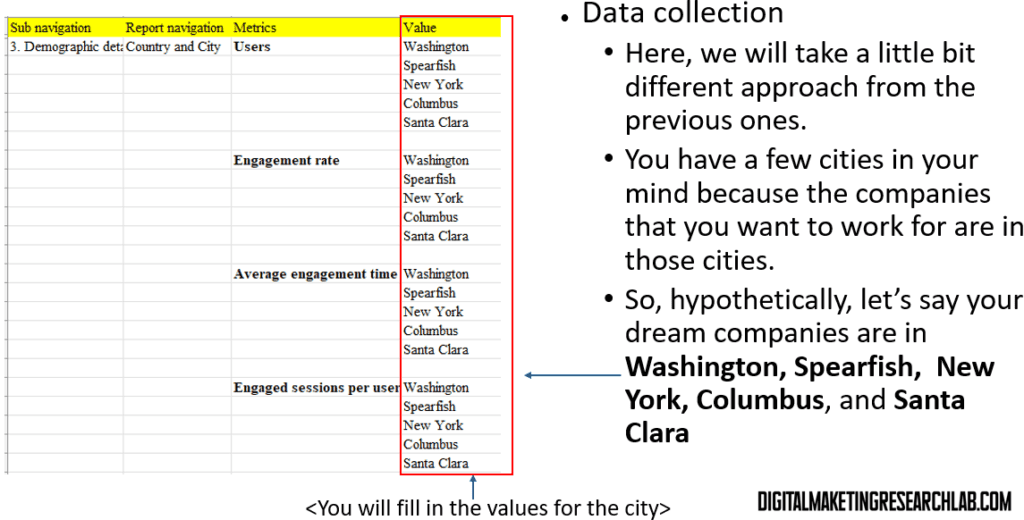
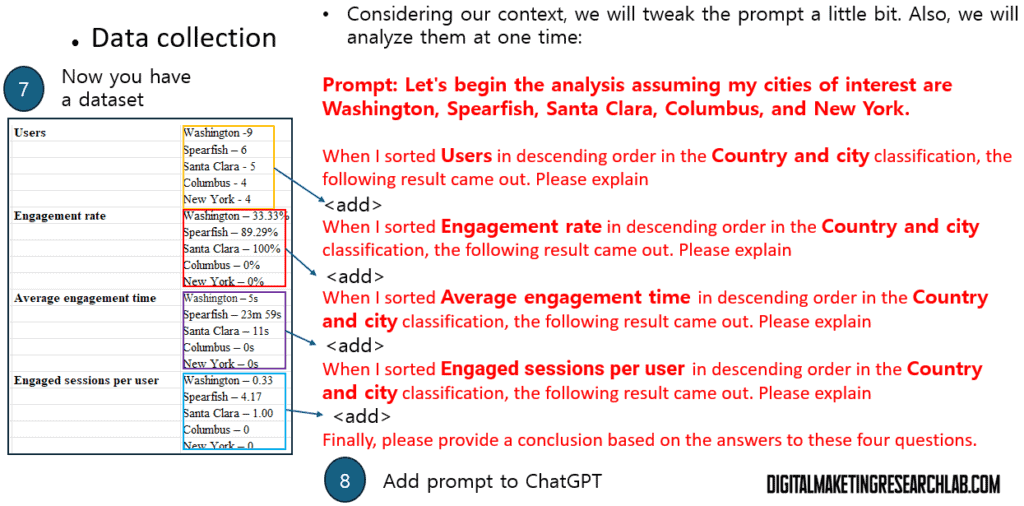
For data collection, Here, we will take a little bit different approach from the previous ones. You have a few cities in your mind because the companies that you want to work for are in those cities. So, hypothetically, let’s say your dream companies are in Washington, Spearfish, New York, Columbus, and Santa Clara. Simply put those cities into the Exel sheet as you can see below.
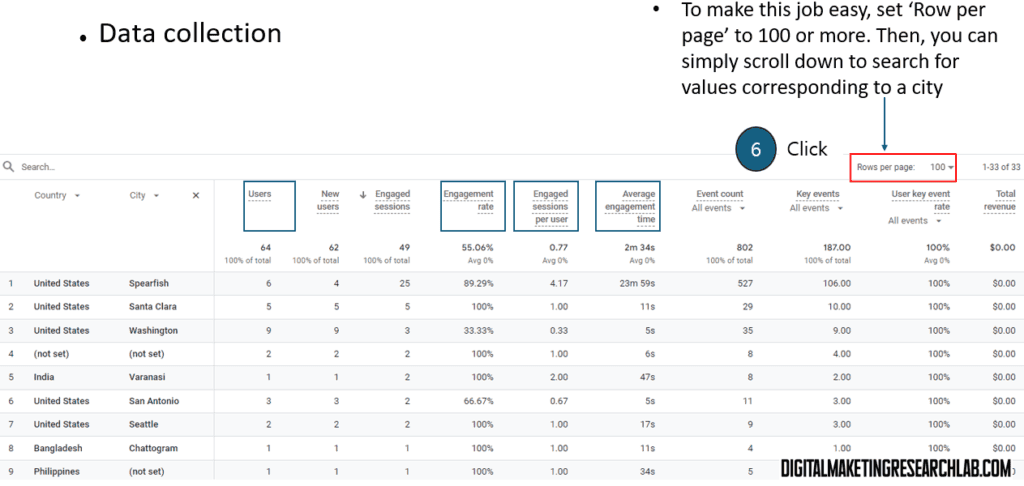
To make this job easy, set ‘Row per page’ to 100 or more. Then, you can simply scroll down to search for values corresponding to a city
Considering your context, you will tweak the prompt a little bit. Also, you will analyze them at one time by using the prompt below. Add the prompt to ChatGPT.
Prompt: Let’s begin the analysis assuming my cities of interest are Washington, Spearfish, Santa Clara, Columbus, and New York.
When I sorted Active users in descending order in the Country and city classification, the following result came out. Please explain
<add data on Active users here>
When I sorted Engagement rate in descending order in the Country and city classification, the following result came out. Please explain
<add data on Engagement rate here>
When I sorted Average engagement time per active user in descending order in the Country and city classification, the following result came out. Please explain
<add data on Average engagement time per active user here>
When I sorted Engaged sessions per active user in descending order in the Country and city classification, the following result came out. Please explain
<add data on Engaged sessions per active user here>
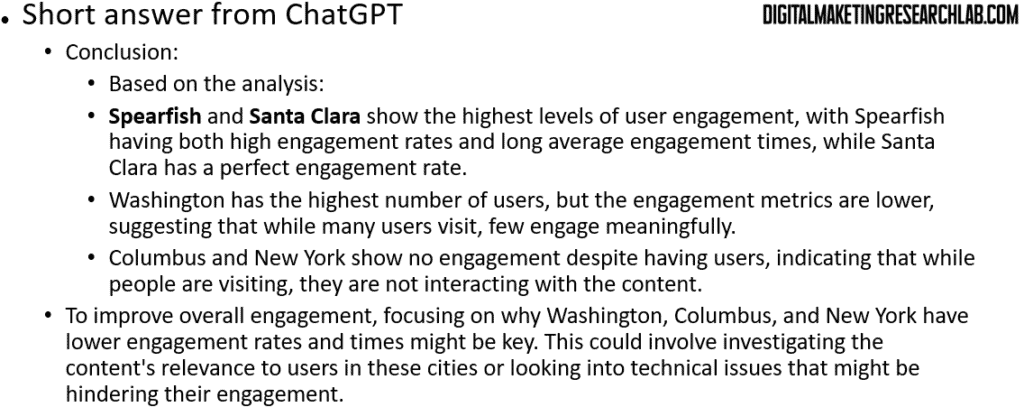
Finally, please provide a conclusion based on the answers to these four questions.
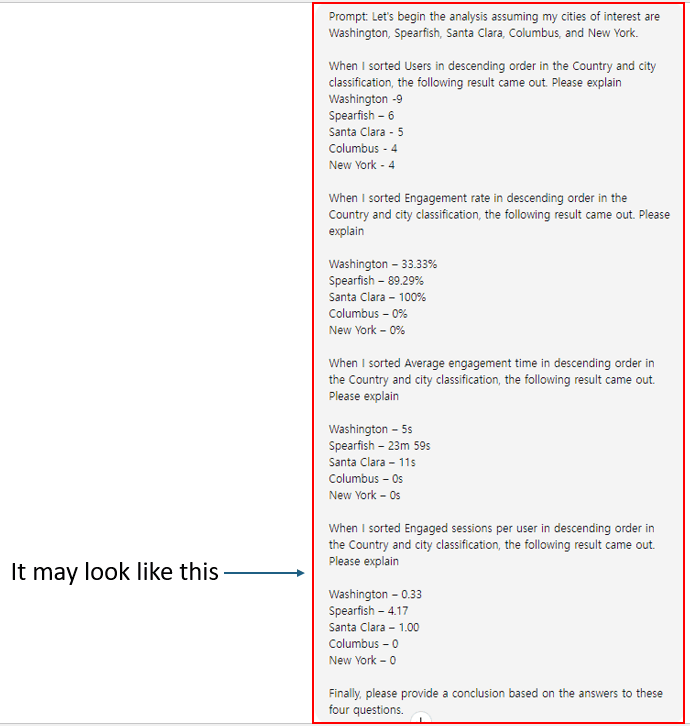
Then, the chat box in ChatGPT may look like below.
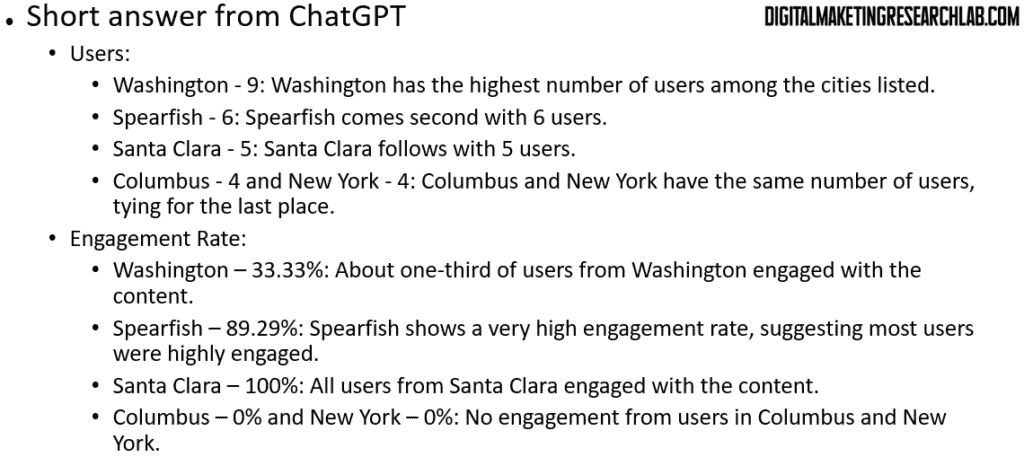
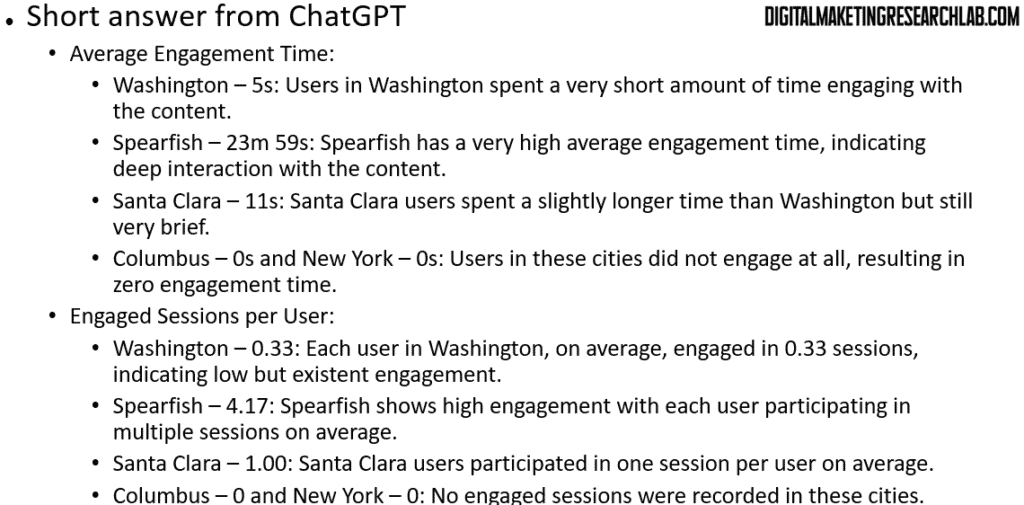
Then, you can have the answers from ChatGPT.
Closing remarks
This comprehensive guide provides a structured approach to analyzing your digital marketing efforts using Google Analytics 4 (GA4). By focusing on key metrics such as user acquisition, page views, demographic details, and engagement rates, you can gain valuable insights into the effectiveness of your strategies. The step-by-step instructions for data collection and analysis, combined with the use of ChatGPT for interpretation, offer a powerful method to understand your website’s performance and its impact on potential employers.
This approach allows you to identify which content resonates most with your target audience, which traffic sources are most effective, and how well you’re reaching your desired geographic locations. By regularly reviewing these metrics and adjusting your strategies accordingly, you can continually improve your digital presence and increase your appeal to potential employers in your chosen field. Remember to always consider the context of your data and be prepared to intervene in the analysis when necessary, as you possess knowledge about your specific situation that AI tools may not have.