
Digital Marketing Metrics and Analytics
Today, we will learn digital marketing metrics and analytics. Also, wwe will explore Google Analytics 4 (GA4) and useful metrics on in.
Introduction to Digital Marketing Metrics
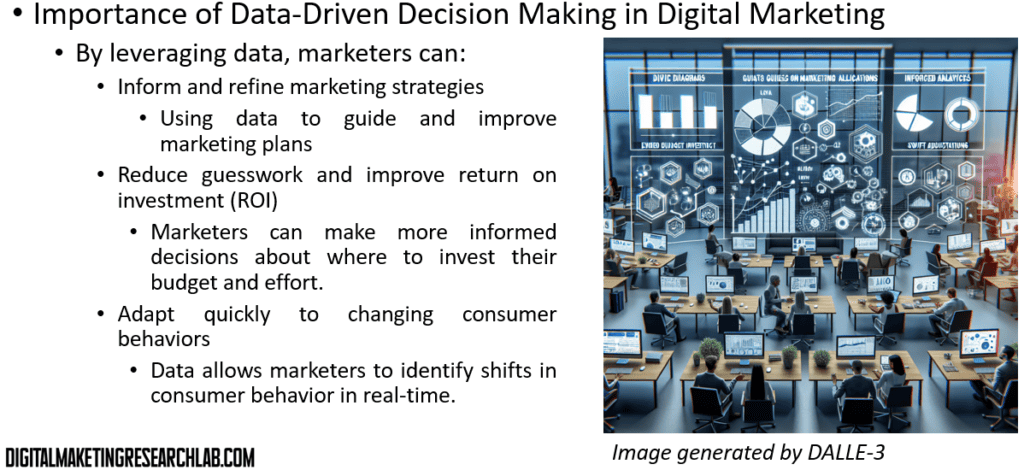
Data-driven decision making has become the cornerstone of effective digital marketing. By leveraging data, marketers can perform various tasks. First, they can inform and refine marketing strategies. It means using data to guide and improve marketing plans. For example, if data shows that email campaigns have a higher conversion rate than social media ads, you might allocate more resources to email marketing. It also involves A/B testing different approaches and using the results to optimize future campaigns.
They also can reduce guesswork and improve return on investment (ROI). By relying on data rather than intuition, marketers can make more informed decisions about where to invest their budget and effort. For instance, if data shows that a particular audience segment is more responsive to your ads, you can focus your spending on that group for better ROI.
Furthermore, they can adapt quickly to changing consumer behaviors. Data allows marketers to identify shifts in consumer behavior in real-time. For example, if you notice a sudden increase in mobile traffic, you might prioritize mobile-optimized content and ads. This agility helps businesses stay relevant in rapidly changing markets.
Rather than relying on intuition alone, successful marketers use data to guide their decisions, leading to more efficient and effective campaigns.
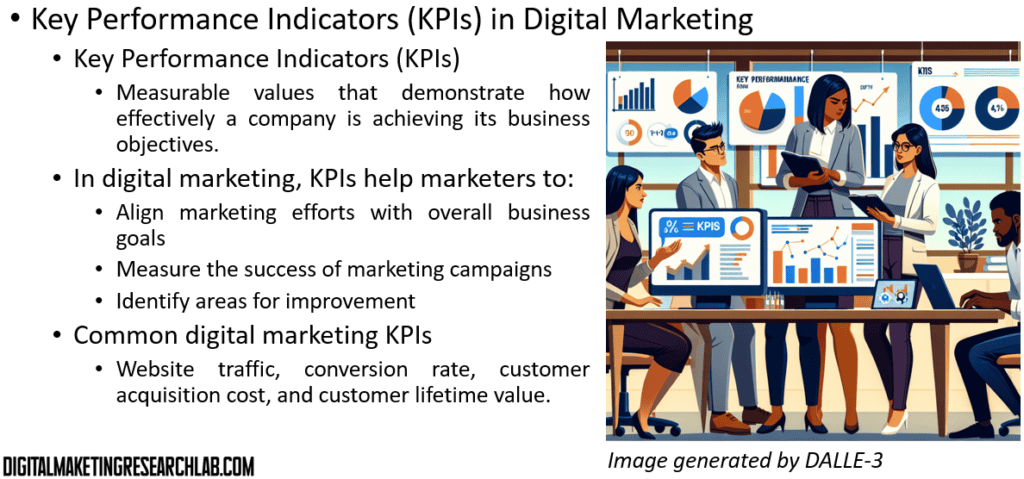
Key Performance Indicators (KPIs) are measurable values that demonstrate how effectively a company is achieving its business objectives. In digital marketing, KPIs help marketers to fulfill various works.
First, they can align marketing efforts with overall business goals. Also, they can measure the success of marketing campaigns. KPIs provide concrete metrics to evaluate campaign performance. For instance, you might use conversion rate to measure the effectiveness of a landing page, or engagement rate for social media content. This allows marketers to determine which campaigns are working and which need improvement. Next, they can identify areas for improvement. By analyzing KPIs, marketers can spot weaknesses in their strategies. For example, a high bounce rate might indicate that your website content isn’t meeting visitor expectations, signaling a need for improvement.
Common digital marketing KPIs include website traffic, conversion rate, customer acquisition cost, and customer lifetime value.
Types of Digital Marketing Metrics
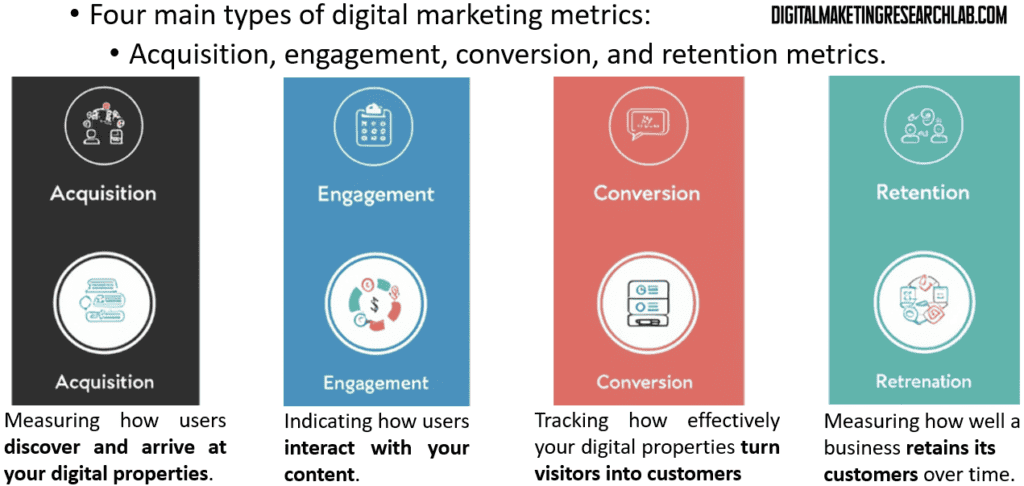
Digital marketing metrics can be categorized into four main types: acquisition, engagement, conversion, and retention metrics.
Acquisition metrics measure how users discover and arrive at your digital properties. Engagement metrics indicate how users interact with your content. Conversion metrics track how effectively your digital properties turn visitors into customers. Retention metrics measure how well a business retains its customers over time.
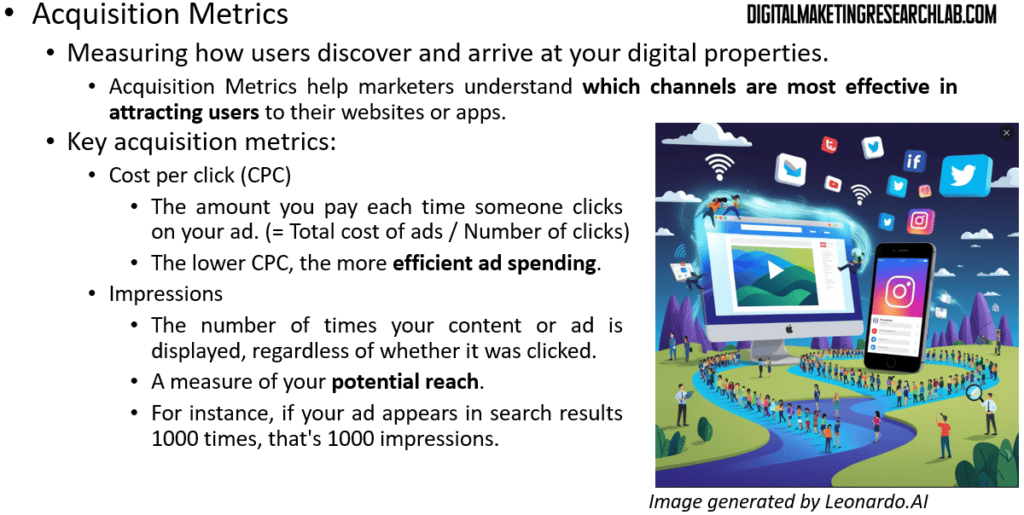
Acquisition metrics measure how users discover and arrive at your digital properties. Key acquisition metrics include:
– Cost per click (CPC): This is the amount you pay each time someone clicks on your ad. It’s calculated by dividing the total cost of your ads by the number of clicks received. A lower CPC generally indicates more efficient ad spending.
– Impressions: This refers to the number of times your content or ad is displayed, regardless of whether it was clicked. It’s a measure of your potential reach. For instance, if your ad appears in search results 1000 times, that’s 1000 impressions.
These metrics help marketers understand which channels are most effective in attracting users to their websites or apps.
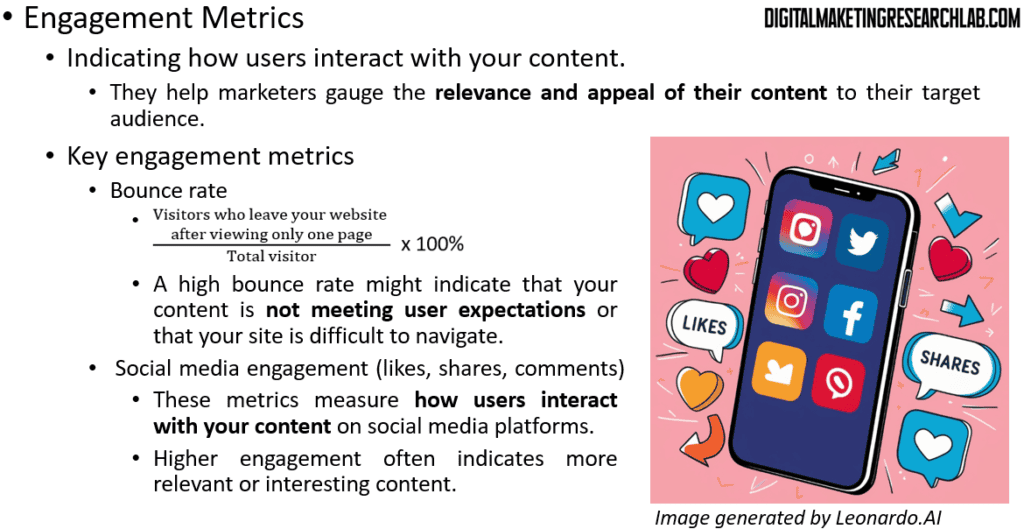
Engagement metrics indicate how users interact with your content. Important engagement metrics include:
– Time on page: This measures how long users spend on a particular page of your website. Longer time on page often indicates more engaging or valuable content. For example, if users spend an average of 3 minutes on your blog posts, that’s generally considered good engagement.
– Pages per session: This is the average number of pages a user views during a single visit to your website. Higher numbers usually indicate more engaging content or effective internal linking. For instance, if users typically view 4 pages before leaving your site, that’s your pages per session metric.

– Bounce rate: This is the percentage of visitors who leave your website after viewing only one page. A high bounce rate might indicate that your content isn’t meeting user expectations or that your site is difficult to navigate. For example, if 60% of visitors leave after viewing just one page, your bounce rate is 60%.
– Social media engagement (likes, shares, comments): These metrics measure how users interact with your content on social media platforms. Higher engagement often indicates more relevant or interesting content. For instance, a post with 100 likes, 50 shares, and 20 comments would be considered highly engaging.
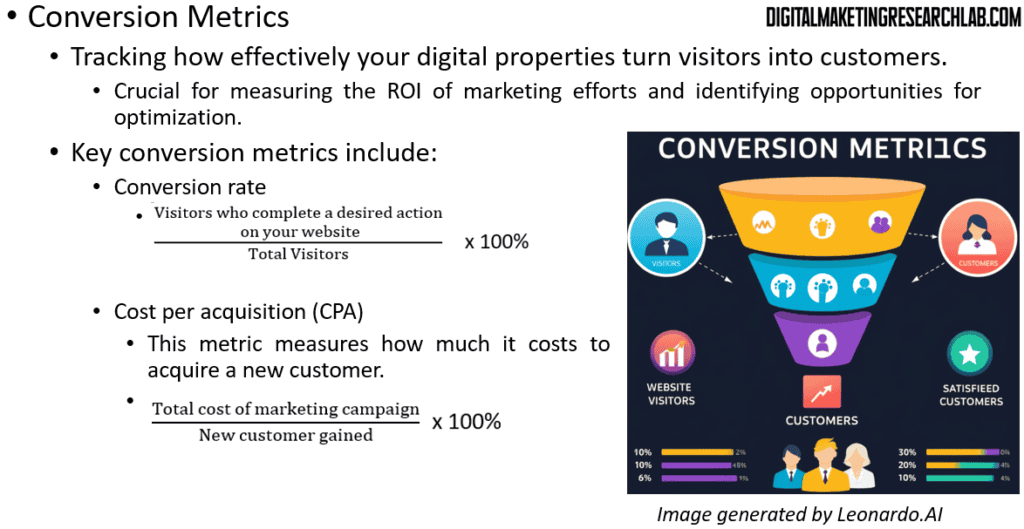
Conversion metrics track how effectively your digital properties turn visitors into customers. Key conversion metrics include:
– Conversion rate: This is the percentage of visitors who complete a desired action on your website. For example, if 100 people visit your site and 5 make a purchase, your conversion rate is 5%. It’s a crucial metric for measuring the effectiveness of your marketing efforts and website design.
– Cost per acquisition (CPA): This metric measures how much it costs to acquire a new customer. It’s calculated by dividing the total cost of a marketing campaign by the number of new customers gained. For instance, if you spend $1000 on a campaign and acquire 20 new customers, your CPA is $50
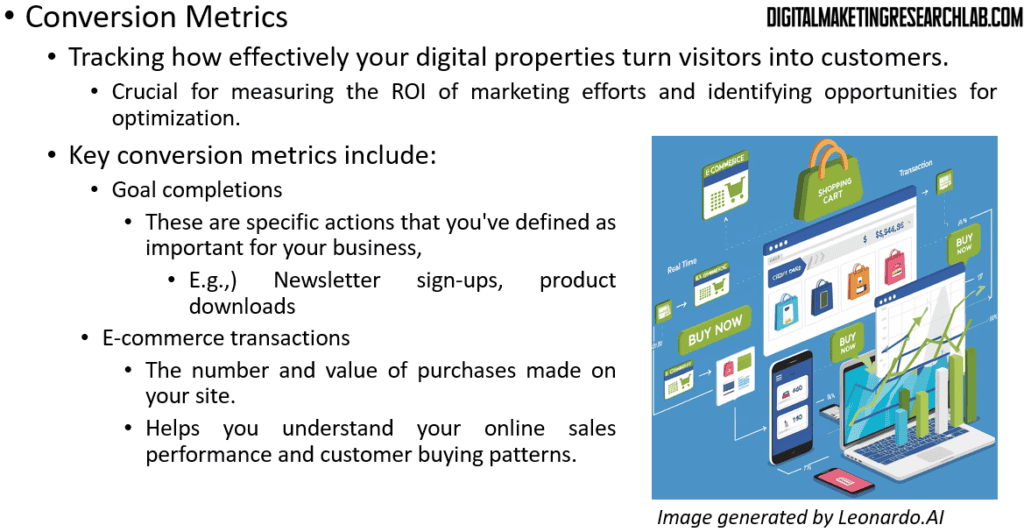
– Goal completions: These are specific actions that you’ve defined as important for your business, such as newsletter sign-ups, product downloads, or contact form submissions. Tracking goal completions helps you understand how well your website is meeting its objectives
– E-commerce transactions: For online stores, this metric tracks the number and value of purchases made on your site. It’s essential for understanding your online sales performance and customer buying patterns.
These metrics are crucial for measuring the ROI of marketing efforts and identifying opportunities for optimization.
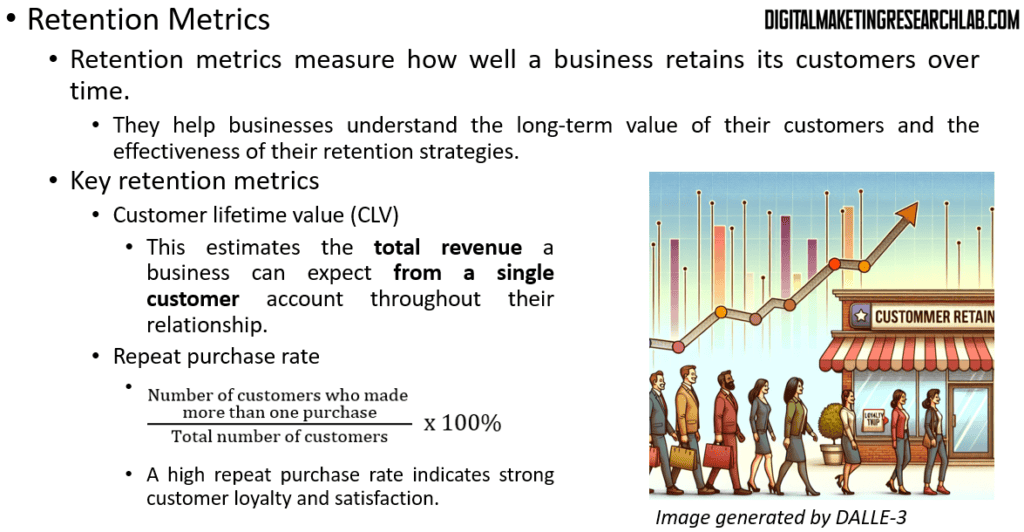
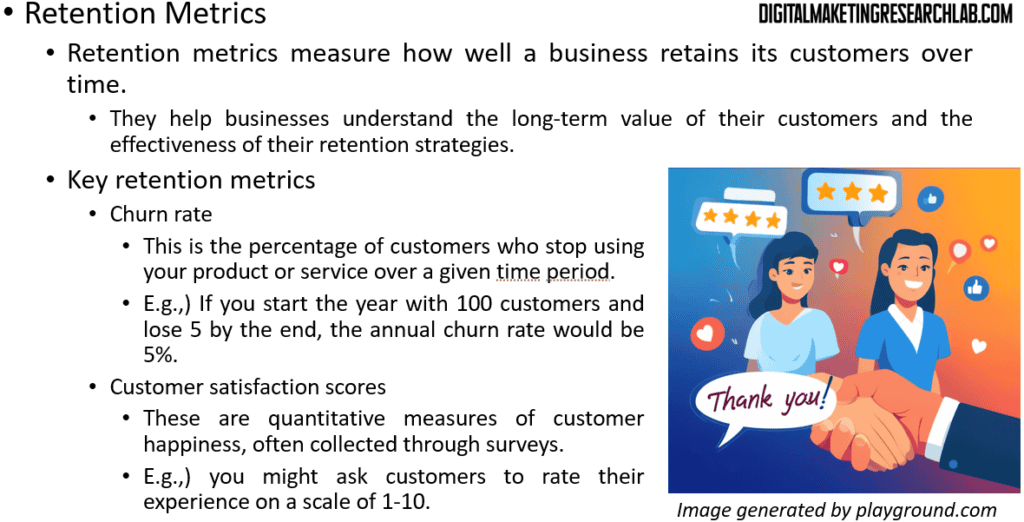
Retention metrics measure how well a business retains its customers over time. Important retention metrics include:
– Customer lifetime value (CLV): This estimates the total revenue a business can expect from a single customer account throughout their relationship. For example, if a customer spends an average of $100 per year and typically remains a customer for 5 years, their CLV would be $500.
– Repeat purchase rate: This measures the percentage of customers who make additional purchases after their first one. A high repeat purchase rate indicates strong customer loyalty and satisfaction.
– Churn rate: This is the percentage of customers who stop using your product or service over a given time period. For example, if you start the year with 100 customers and lose 5 by the end, your annual churn rate would be 5%.
– Customer satisfaction scores: These are quantitative measures of customer happiness, often collected through surveys. For instance, you might ask customers to rate their experience on a scale of 1-10.
These metrics help businesses understand the long-term value of their customers and the effectiveness of their retention strategies.
Google Analytics 4 (GA4) Overview
Google Analytics 4 is the latest version of Google’s web analytics platform, offering enhanced features for tracking user behavior across websites and apps.
Key features and benefits of GA 4 include:
– Event-based data model for more flexible tracking: GA4 uses an event-based model, where any interaction can be captured as an event. This allows for more detailed and customizable tracking compared to the previous session-based model.
– Cross-platform tracking between web and mobile apps: GA4 can track user journeys across both websites and mobile apps, providing a more complete picture of user behavior.
– Enhanced machine learning capabilities for predictive metrics: GA4 uses machine learning to provide predictive insights, such as potential revenue from a specific customer segment or the likelihood of user churn.
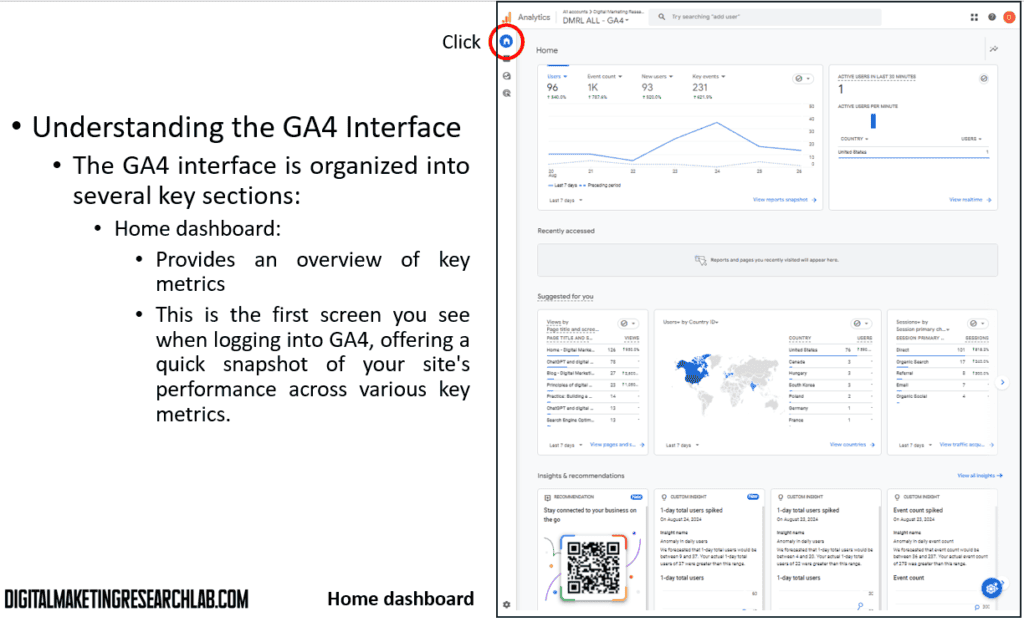
Understanding of the GA4 interface
– Home dashboard: It provides an overview of key metrics. This is the first screen you see when logging into GA4, offering a quick snapshot of your site’s performance across various key metrics.
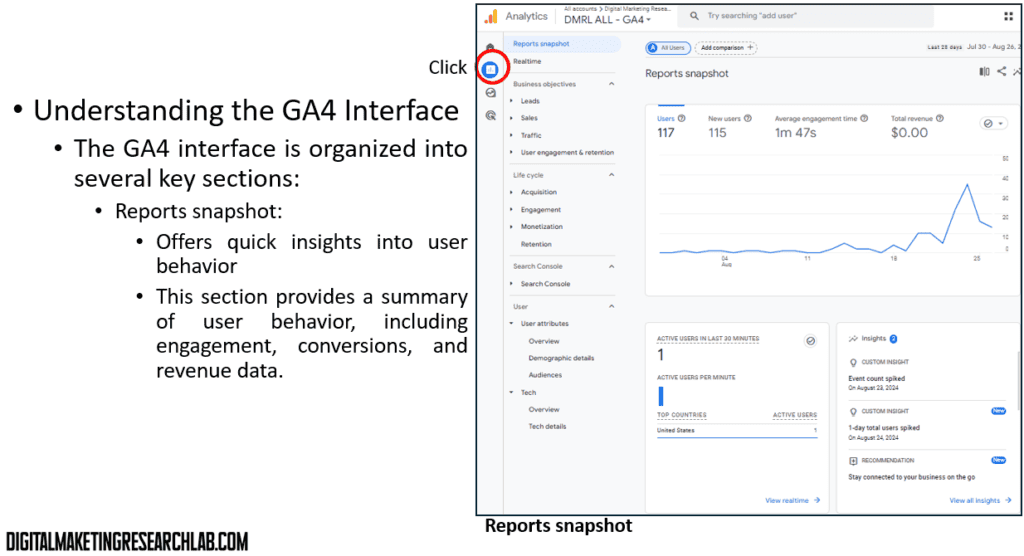
– Reports snapshot: It offers quick insights into user behavior. This section provides a summary of user behavior, including engagement, conversions, and revenue data.
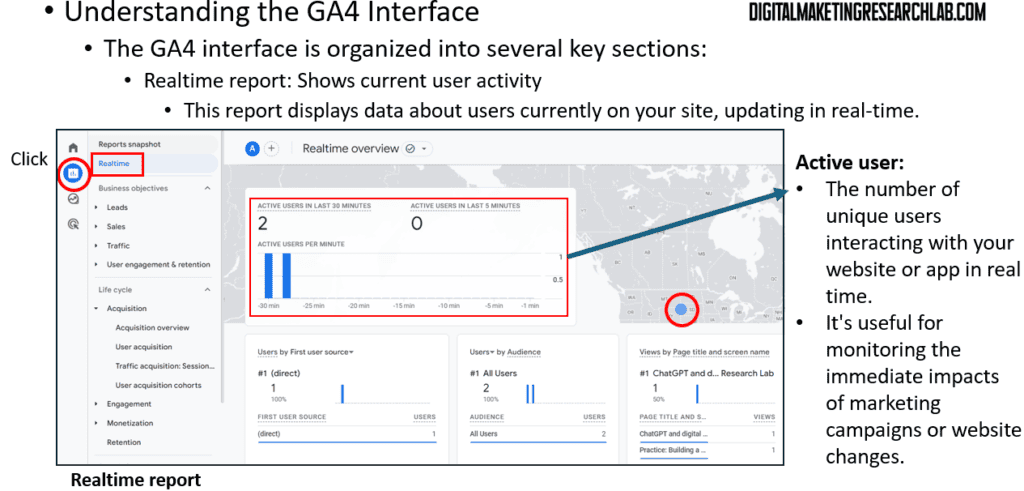
– Realtime report: Shows current user activity: This report displays data about users currently on your site, updating in real-time.
– Active users: This metric shows the number of unique users interacting with your website or app in real-time. It’s useful for monitoring immediate impacts of marketing campaigns or website changes.
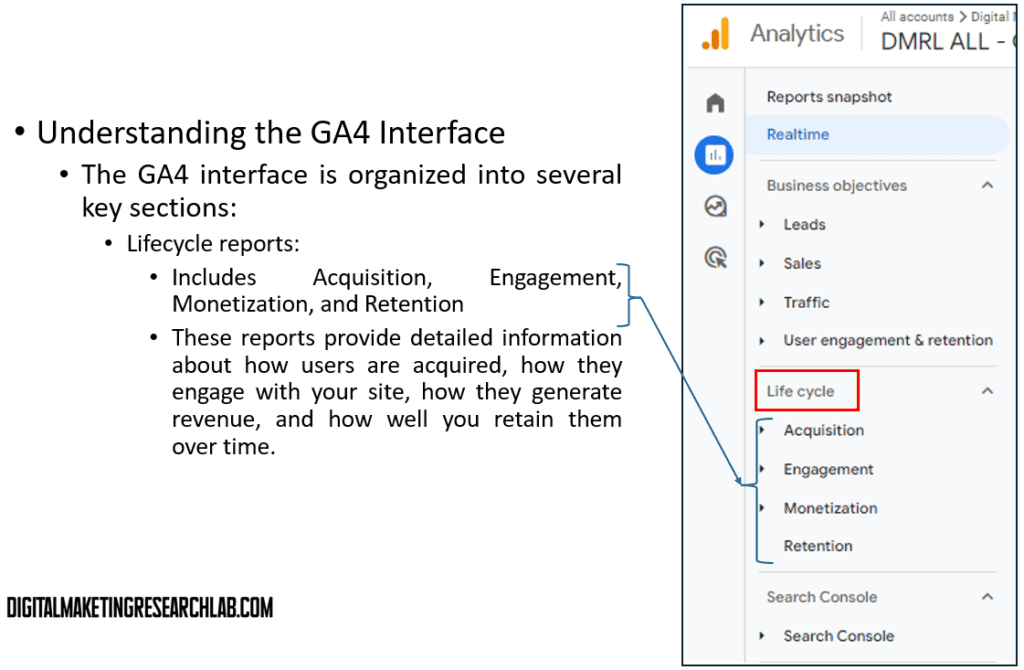
– Lifecycle reports: They includes Acquisition, Engagement, Monetization, and Retention. These reports provide detailed information about how users are acquired, how they engage with your site, how they generate revenue, and how well you retain them over time.
User Acquisition: This report highlights the methods through which new (or, first-time) users are discovering your site for the first time, such as organic search, paid search, social media, or direct traffic.
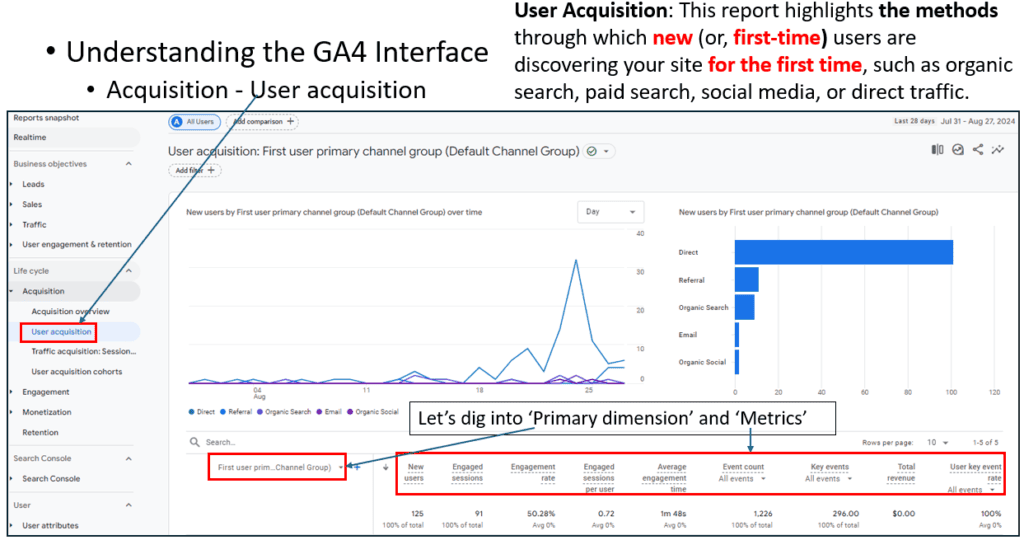
Let’s dig into primary dimensions and metrics.
Primary dimensions include:
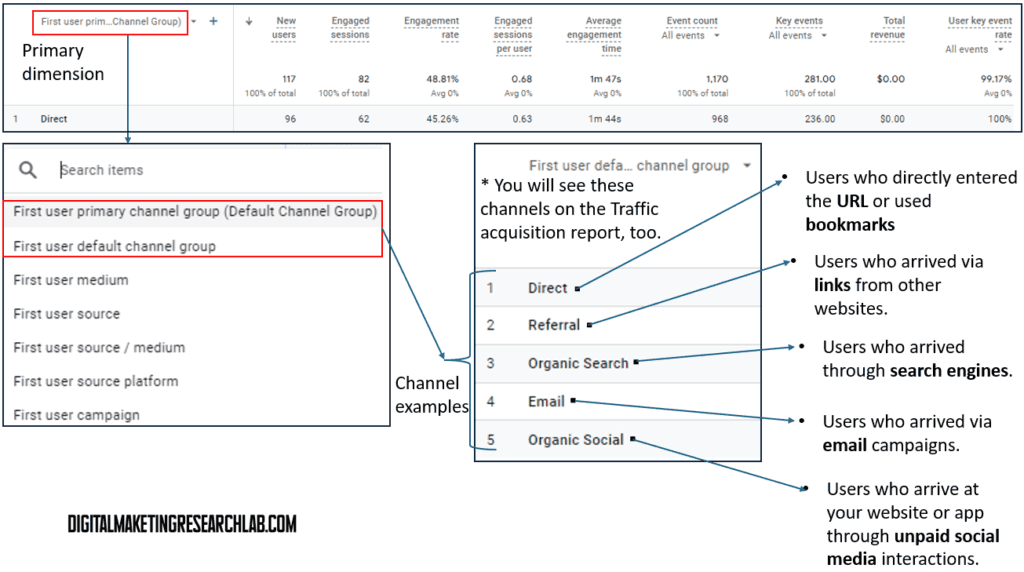
- First user primary channel group: The primary group classification based on the user’s initial interaction with the website or app, using predefined channel groupings in Google Analytics, such as Organic Search, Direct, Paid Search, etc.
- First user default channel group: In reality, very similar to the First User Primary Channel Group
- First user medium: The medium refers to the general category of the source that brought the user to the website or app for the first time. Common mediums include Organic, CPC (Cost-Per-Click), Direct, and Referral.
- First user source: This indicates the specific origin or referrer by which the user first arrived at the website or app, such as a particular search engine (e.g., Google) or a domain name (e.g., example.com).
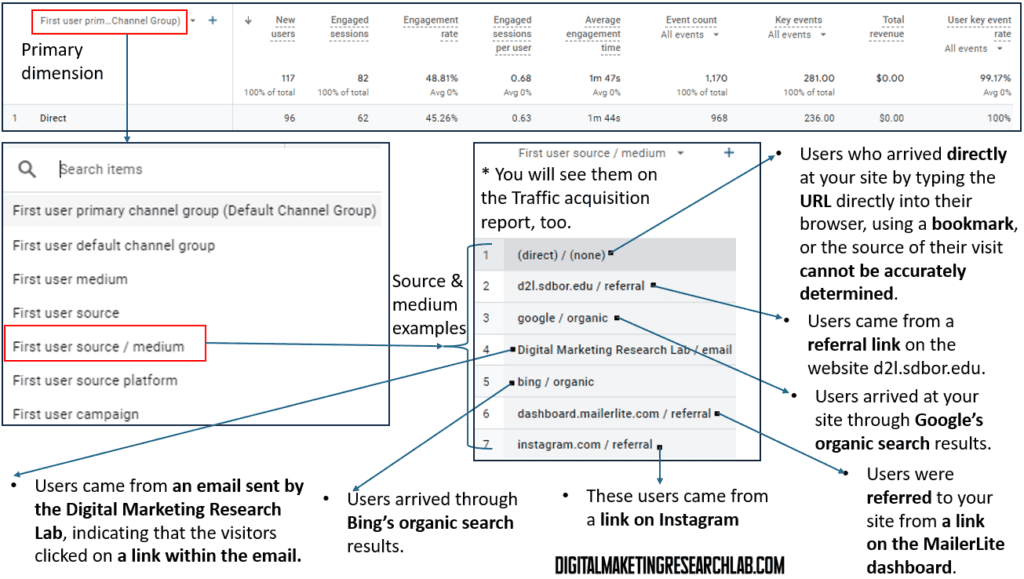
- First user source/medium: It shows the combination of the referrer and the type of referral, such as Google / organic or Facebook / paid_social.
- First user source platform: This term refers to the platform where the user’s initial interaction originated. It could include platforms such as web or apps, specifying the environment of the first user session
- First user campaign: This includes the name of the marketing campaign that led to the user’s first visit.
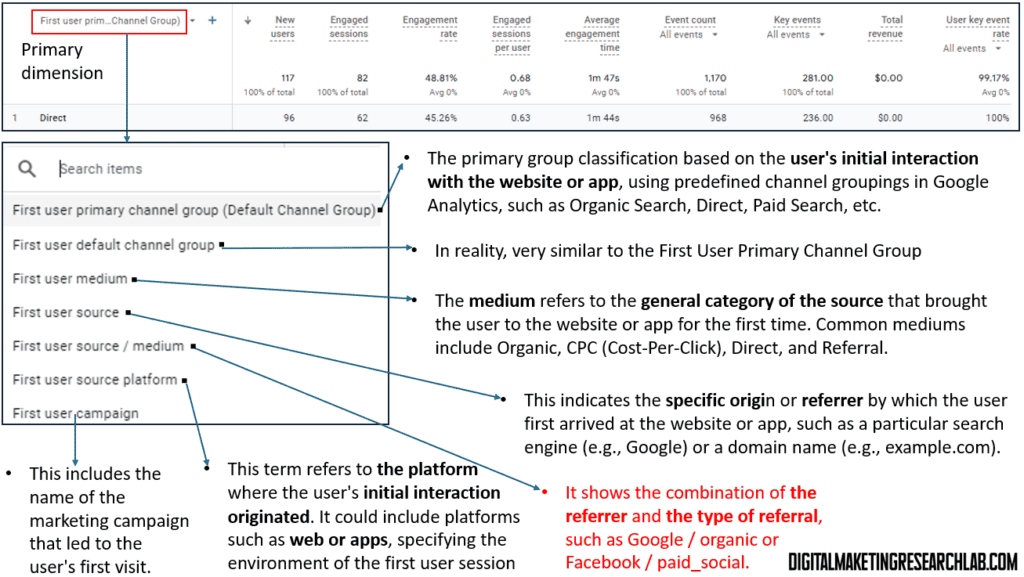
Under the primary dimension, ‘First user primary channel group’ and ‘First user default channel group’ enables you to investigate into ‘Channels’ from which users are acquired.
- Direct: Users who directly entered the URL or used bookmarks
- Referral: Users who arrived via links from other websites.
- Organic Search: Users who arrived through search engines.
- Email: Users who arrived via email campaigns.
- Organic Social: Users who arrive at your website or app through unpaid social media interactions.
Under the primary dimension, ‘First user source / medium’ helps you to track the source & medium from which users are acquired.
- (direct) / (none): Users who arrived directly at your site by typing the URL directly into their browser, using a bookmark, or the source of their visit cannot be accurately determined.
- d2l.sdbor.edu/referral: Users came from a referral link on the website d2l.sdbor.edu.
- google/organic: Users arrived at your site through Google’s organic search results.
- Digital Marketing Research Lab/email: Users came from an email sent by the Digital Marketing Research Lab, indicating that the visitors clicked on a link within the email.
- Instagram.com/referral: These users came from a link on Instagram
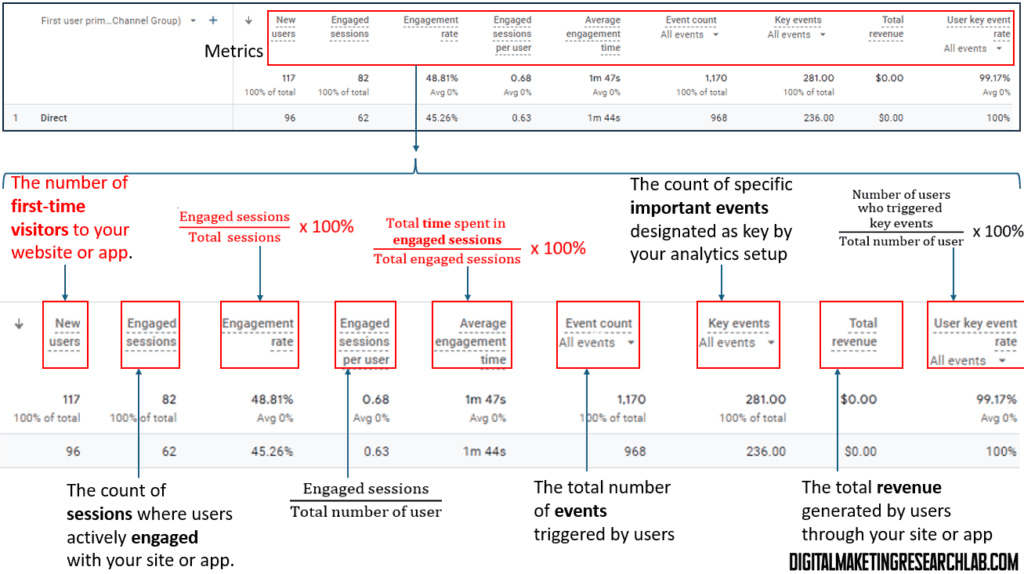
Metrics include:
- New users: The number of first-time visitors to your website or app.
- Engaged sessions: The count of sessions where users actively engaged with your site or app.
- Engagement rate: (Engaged sessions / Total sessions) X 100%
- Engaged sessions per user: Engaged sessions / Total number of users
- Average engagement time: (Total time spent in engaged sessions / Total engaged sessions) X 100%
- Event count: The total number of events triggered by users
- Key events: The count of specific important events designated as key by your analytics setup
- Total revenue: The total revenue generated by users through your site or app
- User key event: (Number of users who triggered key events / Total number of users) X 100%
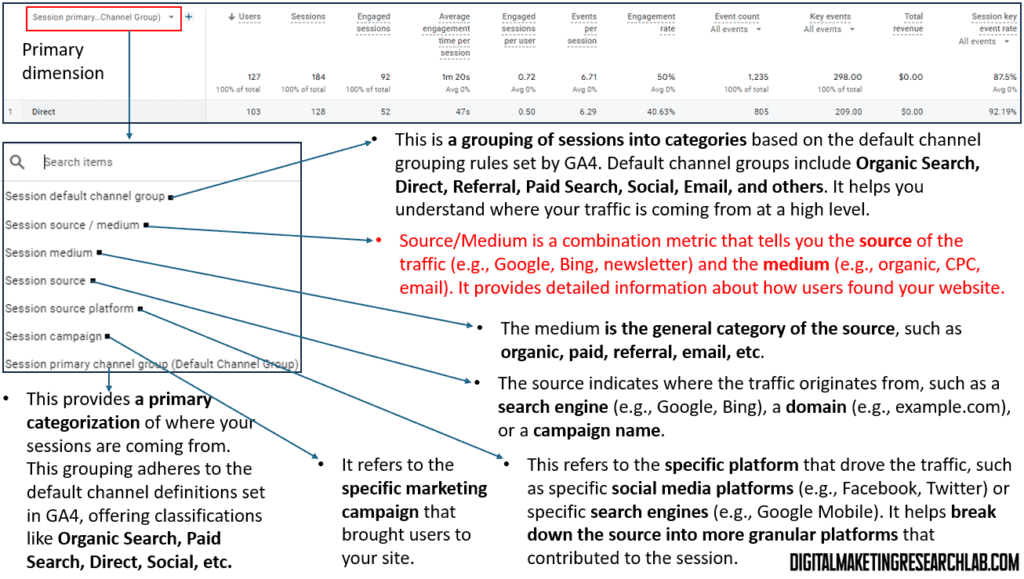
Traffic acquisition: This report shows the channels through which (both first-time and returning) users are finding your site, such as organic search, paid search, social media, or direct traffic.
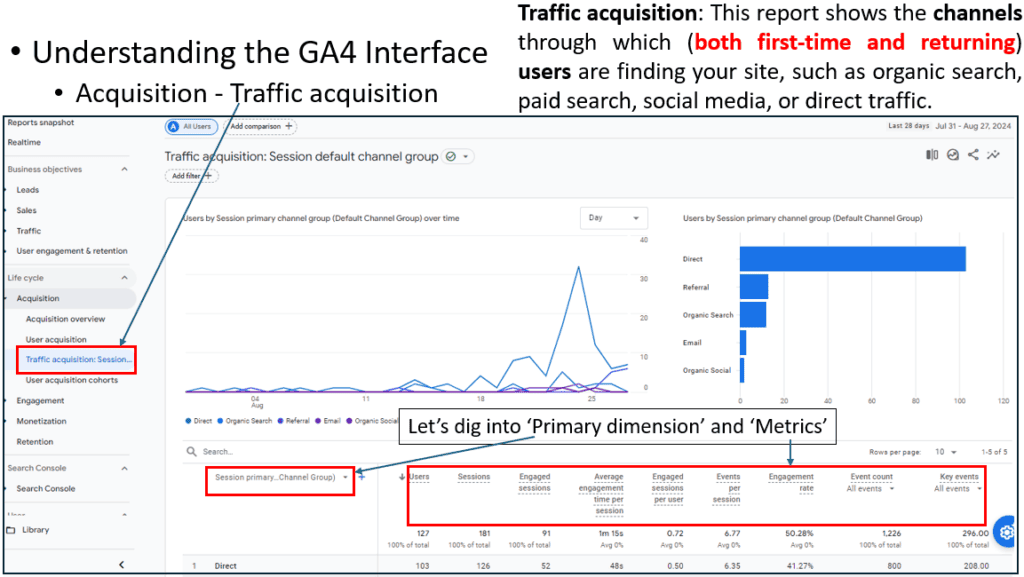
Let’s dig into primary dimensions and metrics.
Primary dimensions include:
- Session source: The source indicates where the traffic originates from, such as a search engine (e.g., Google, Bing), a domain (e.g., example.com), or a campaign name.
- Session platform: This refers to the specific platform that drove the traffic, such as specific social media platforms (e.g., Facebook, Twitter) or specific search engines (e.g., Google Mobile). It helps break down the source into more granular platforms that contributed to the session.
- Session campaign: It refers to the specific marketing campaign that brought users to your site.
- Session primary channel group (Default Channel Group): This provides a primary categorization of where your sessions are coming from. This grouping adheres to the default channel definitions set in GA4, offering classifications like Organic Search, Paid Search, Direct, Social, etc.
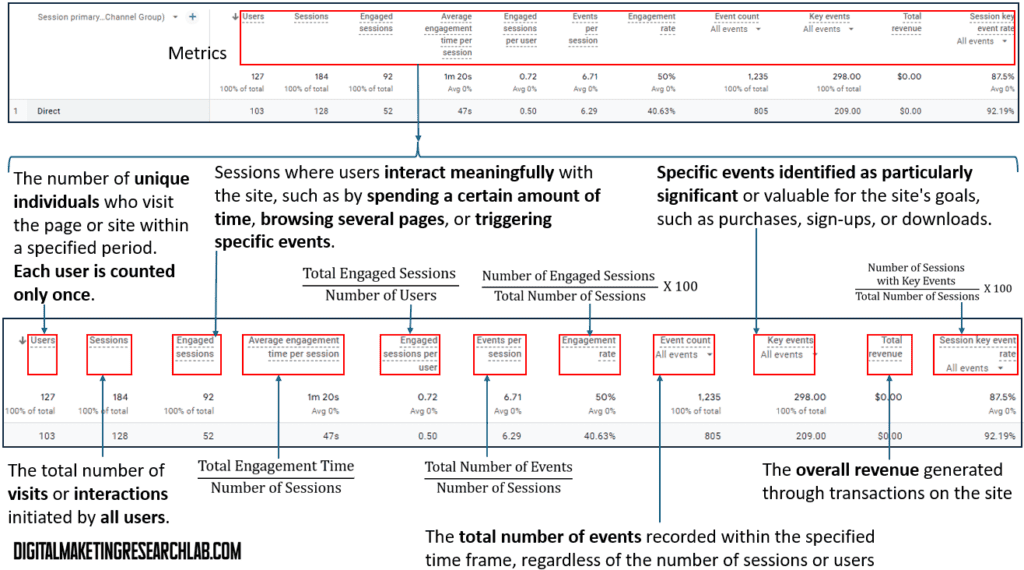
Metrics include:
- Users: The number of unique individuals who visit the page or site within a specified period. Each user is counted only once.
- Sessions: The total number of visits or interactions initiated by all users.
- Engaged sessions: Sessions where users interact meaningfully with the site, such as by spending a certain amount of time, browsing several pages, or triggering specific events.
- Average engagement time per session: Total engagement time / Number of sessions
- Engaged sessions per user: Total engagement sessions / Number of users
- Event count: The total number of events recorded within the specified time frame, regardless of the number of sessions or users
- Key events: Specific events identified as particularly significant or valuable for the site’s goals, such as purchases, sign-ups, or downloads.
- Total revenue: The overall revenue generated through transactions on the site
- Session key events rate: (Number of sessions with key events / Total number of sessions) X 100
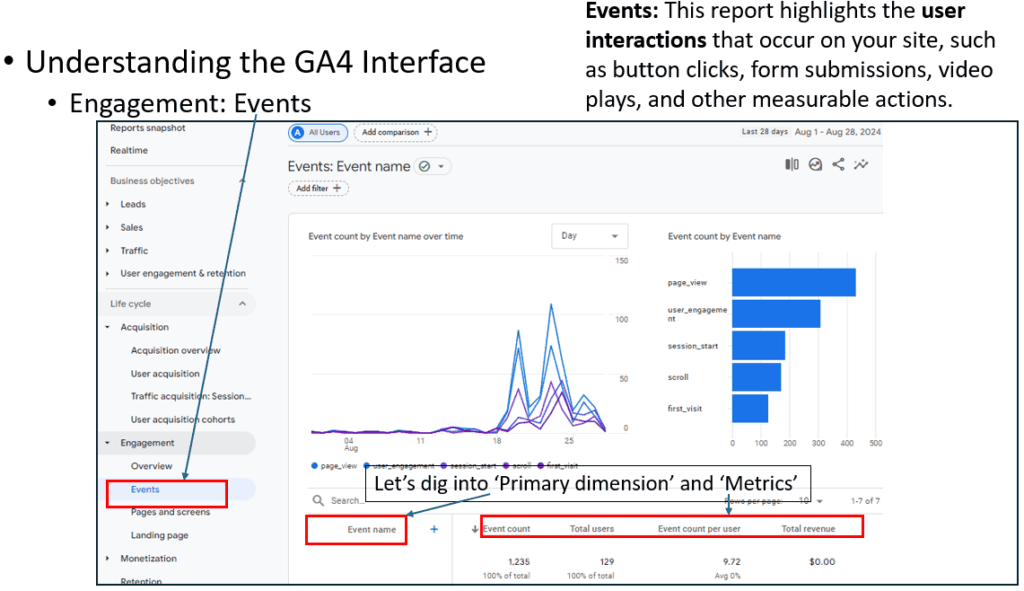
Engagement – Events: This report highlights the user interactions that occur on your site, such as button clicks, form submissions, video plays, and other measurable actions.
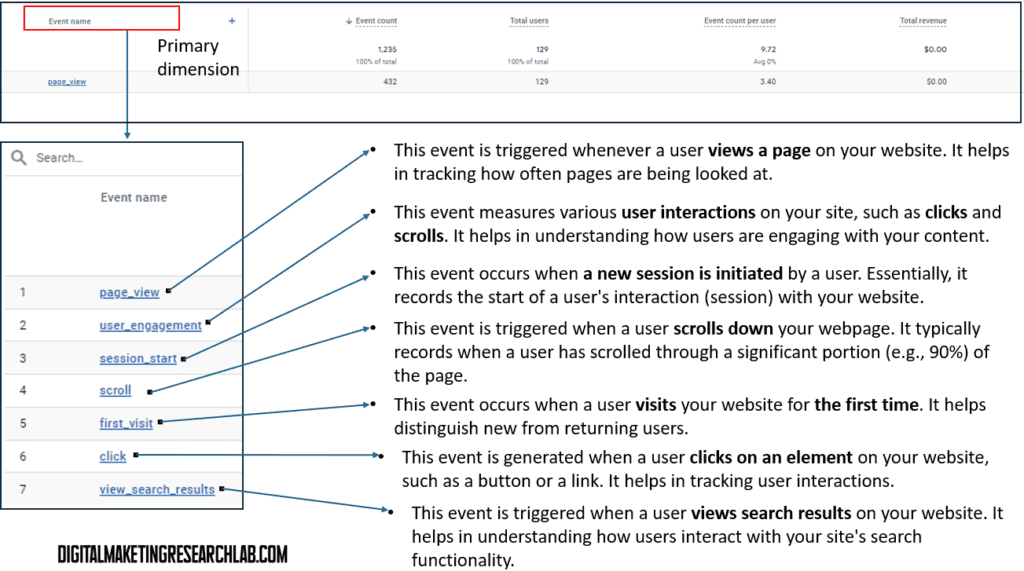
Under the primary dimension, you can find one option, ‘event name’ which indicates the event users were involved.
- page view: This event is triggered whenever a user views a page on your website. It helps in tracking how often pages are being looked at.
- user engagement: This event measures various user interactions on your site, such as clicks and scrolls. It helps in understanding how users are engaging with your content.
- session start: This event occurs when a new session is initiated by a user. Essentially, it records the start of a user’s interaction (session) with your website.
- Scroll: This event is triggered when a user scrolls down your webpage. It typically records when a user has scrolled through a significant portion (e.g., 90%) of the page.
- first visit: This event occurs when a user visits your website for the first time. It helps distinguish new from returning users.
- click: This event is generated when a user clicks on an element on your website, such as a button or a link. It helps in tracking user interactions.
- view search result: This event is triggered when a user views search results on your website. It helps in understanding how users interact with your site’s search functionality.
Metrics include:
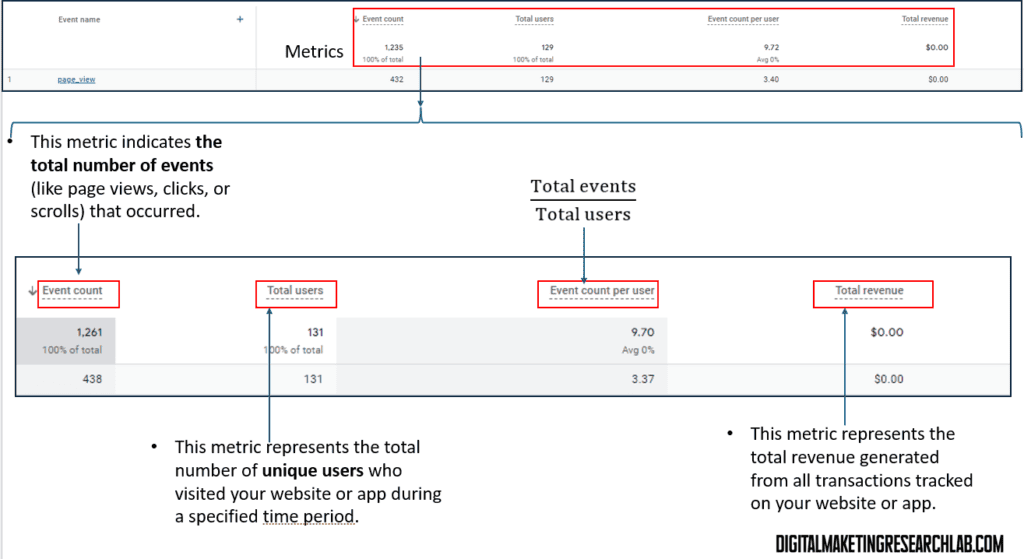
- Event count: This metric indicates the total number of events (like page views, clicks, or scrolls) that occurred.
- Total users: This metric represents the total number of unique users who visited your website or app during a specified time period.
- Event count per user: Total events / Total users
- Total revenue: This metric represents the total revenue generated from all transactions tracked on your website or app.
Pages and screens: This report provides insights into the specific pages and screens that users are visiting on your website or app.
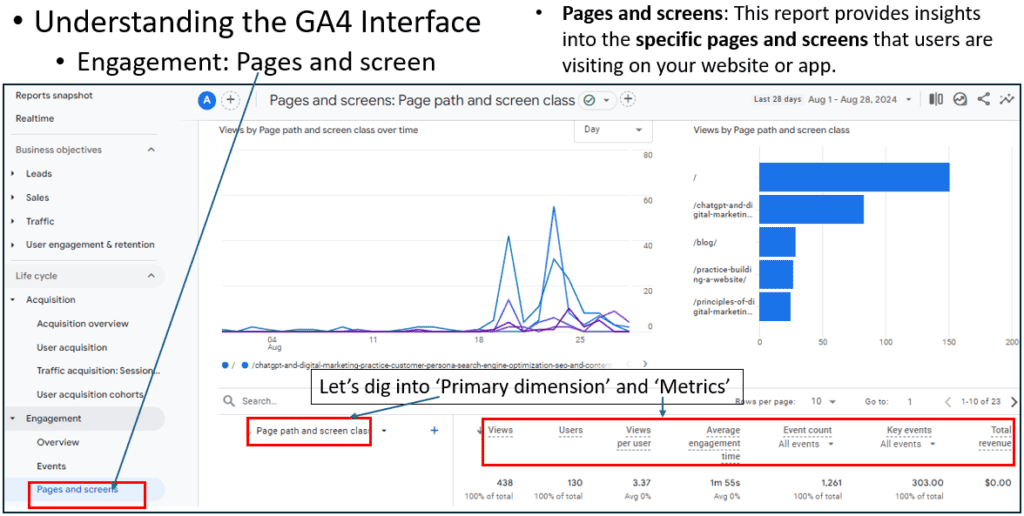
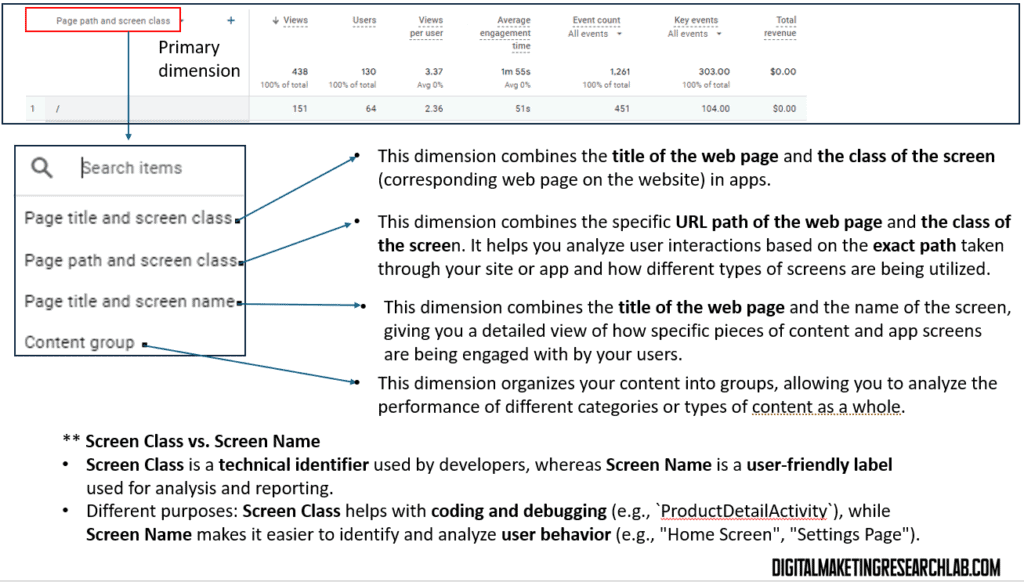
Primary dimensions include:
- Page title and screen class: This dimension combines the title of the web page and the class of the screen (corresponding web page on the website) in apps.
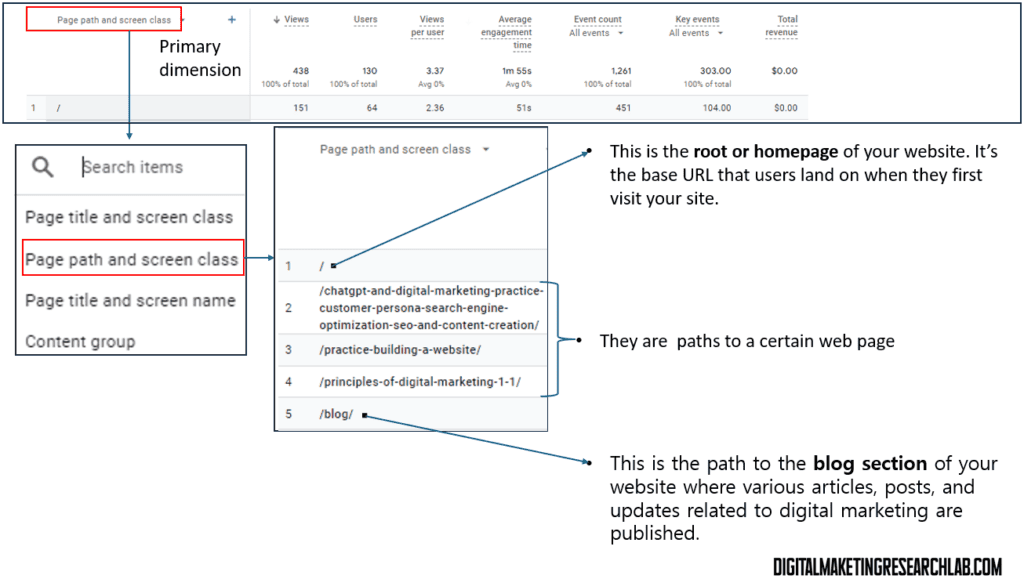
- Page path and screen class: This dimension combines the specific URL path of the web page and the class of the screen. It helps you analyze user interactions based on the exact path taken through your site or app and how different types of screens are being utilized.
- Page title and screen name: This dimension combines the title of the web page and the name of the screen, giving you a detailed view of how specific pieces of content and app screens are being engaged with by your users.
- Content group: This dimension organizes your content into groups, allowing you to analyze the performance of different categories or types of content as a whole.
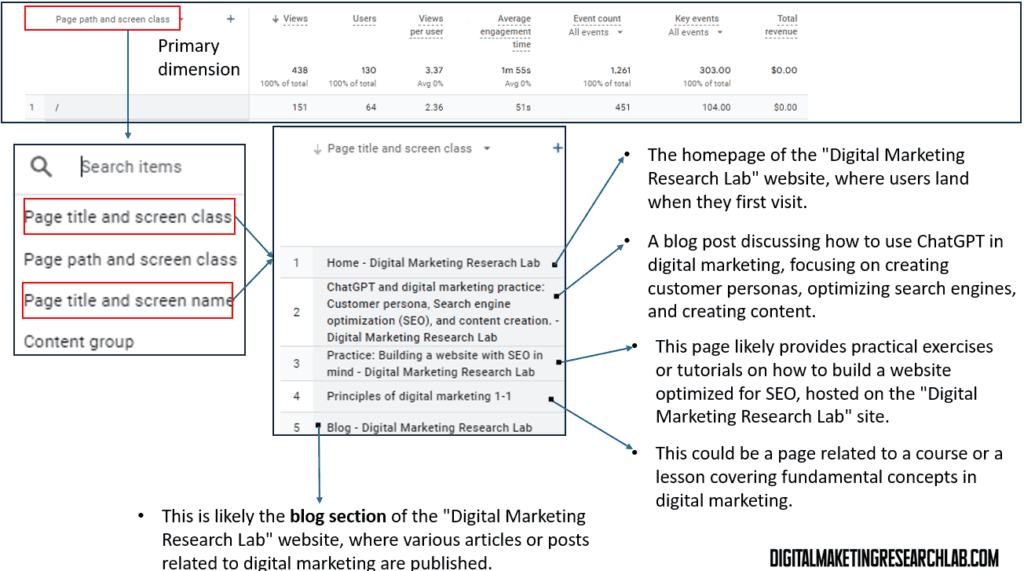
Under the primary dimension, you can find ‘Page title and screen class’ which shows what pages were viewed by users.
- Home – Digital Marketing Research Lab: The homepage of the “Digital Marketing Research Lab” website, where users land when they first visit.
- ChatGPT and digital marketing practice: Customer persona, Search engine optimization (SEO), and content creation. – Digital Marketing Research Lab: A blog post discussing how to use ChatGPT in digital marketing, focusing on creating customer personas, optimizing search engines, and creating content.
- Practice: Building a website with SEO in mind – Digital Marketing Research Lab: This page likely provides practical exercises or tutorials on how to build a website optimized for SEO, hosted on the “Digital Marketing Research Lab” site.
- Principles of digital marketing 1-1: This could be a page related to a course or a lesson covering fundamental concepts in digital marketing.
- Blog – Digital Marketing Research Lab: This is likely the blog section of the “Digital Marketing Research Lab” website, where various articles or posts related to digital marketing are published.
Under the primary dimension, you can find ‘Page path and screen class’ which shows the URL of the pages that the users viewed.
- /: This is the root or homepage of your website. It’s the base URL that users land on when they first visit your site.
- /practice-building-a-website/: this a path to a web page, practice-building-a-website
- /blog/: This is the path to the blog section of your website where various articles, posts, and updates related to digital marketing are published.
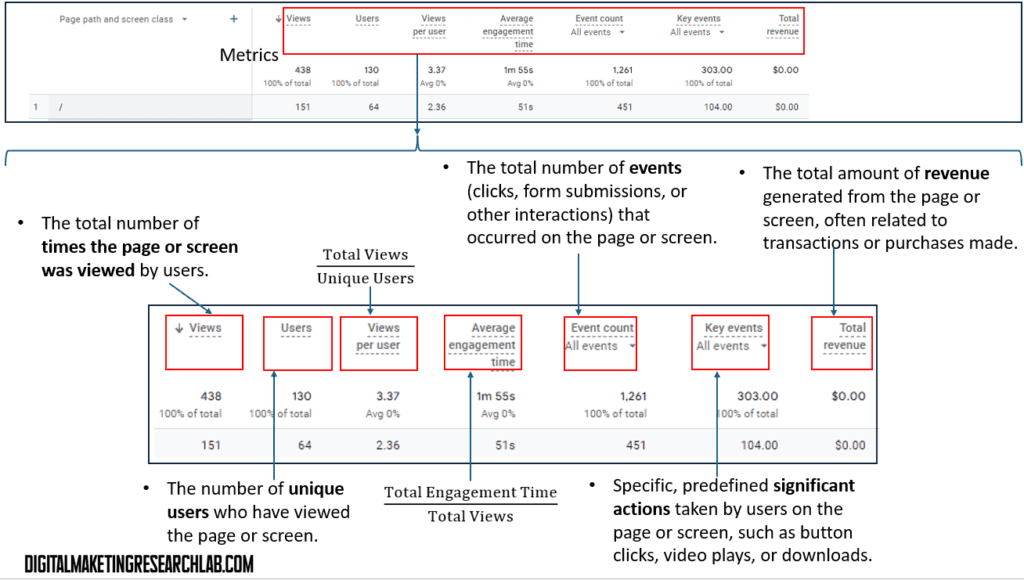
Metrics
- Views: The total number of times the page or screen was viewed by users
- Users: The number of unique users who have viewed the page or screen.
- Views per user: Total views / Unique users
- Average engagement time: Total engagement / Total views
- Event count: The total number of events (clicks, form submissions, or other interactions) that occurred on the page or screen.
- Key events: Specific, predefined significant actions taken by users on the page or screen, such as button clicks, video plays, or downloads.
- Total revenue: The total amount of revenue generated from the page or screen, often related to transactions or purchases made.
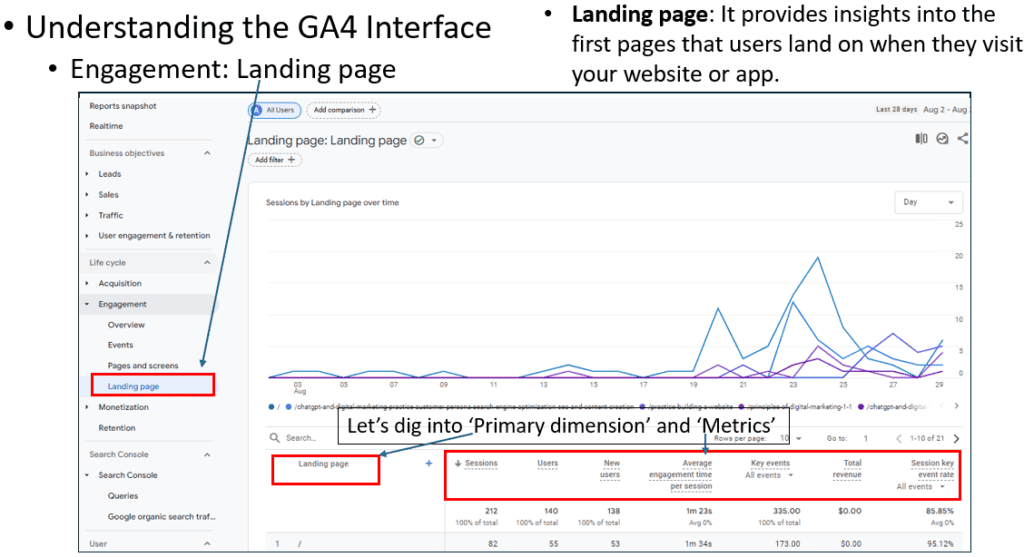
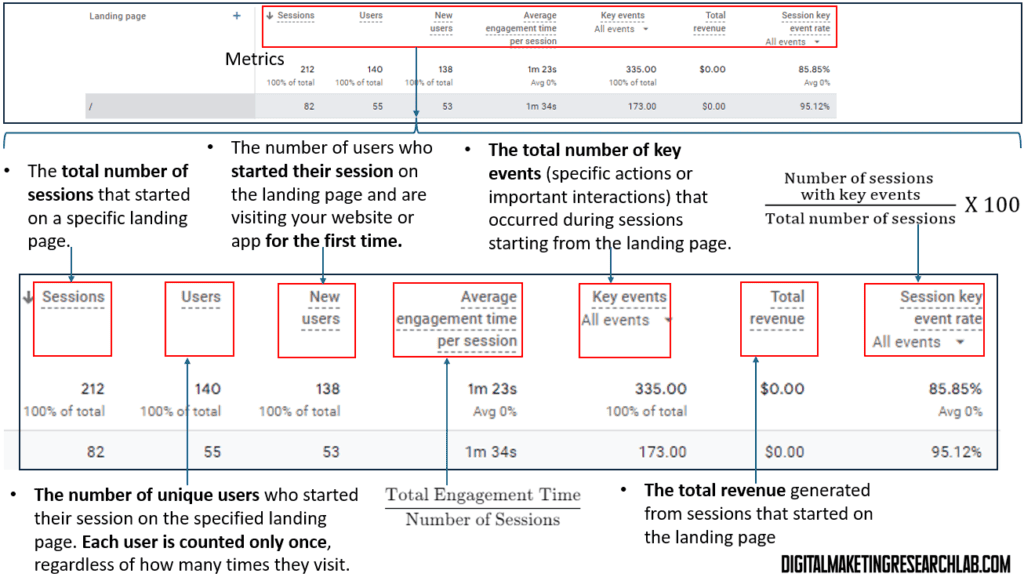
Landing page: It provides insights into the first pages that users land on when they visit your website or app.
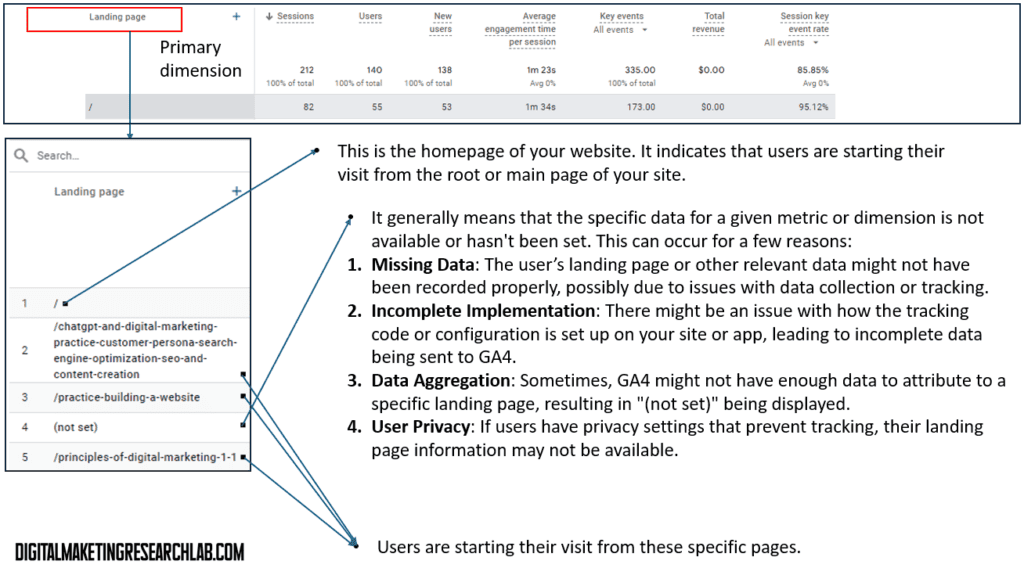
Primary dimension – Landing page
- /: This is the homepage of your website. It indicates that users are starting their visit from the root or main page of your site.
- /practice-building-a-website: Users are starting their visit from these specific pages.
- (not set): It generally means that the specific data for a given metric or dimension is not available or hasn’t been set. This can occur for a few reasons:
- Missing Data: The user’s landing page or other relevant data might not have been recorded properly, possibly due to issues with data collection or tracking.
- Incomplete Implementation: There might be an issue with how the tracking code or configuration is set up on your site or app, leading to incomplete data being sent to GA4.
- Data Aggregation: Sometimes, GA4 might not have enough data to attribute to a specific landing page, resulting in “(not set)” being displayed.
- User Privacy: If users have privacy settings that prevent tracking, their landing page information may not be available.
Metrics
- Sessions: The total number of sessions that started on a specific landing page.
- Users: The number of unique users who started their session on the specified landing page. Each user is counted only once, regardless of how many times they visit.
- New users: The number of users who started their session on the landing page and are visiting your website or app for the first time.
- Average engagement per session: Total engagement time / Number of sessions
- Key events: The total number of key events (specific actions or important interactions) that occurred during sessions starting from the landing page.
- Total revenue: The total revenue generated from sessions that started on the landing page
- Session key event rate: (Number of sessions with key events / Total number of sessions) X 100
** This article was written with the assistance of Claude 3.5.